
Clash Royale Playerbase Snapshot (2025 Q2)

Authors:
Media Guidelines
Are you a content creator covering this blog? That's great! But please, read and follow our media guidelines when using our content.
Last updated: 2025-05-04
Page change log:
- Created: 2025-05-04
Page contents:
Game analytics are often hidden from the general public. Aside from leaderboards and basic approximations, it's very hard to find real metrics.
This blog aims to change that for Clash Royale, as we'll look into almost 10 years of player behaviour.
About this snapshot
Our research has limitations, but you can expect to find details like player acquisition, long-term retention, Daily Active Users (DAU), Pass Royale revenue, time played per user and many other stats.
Unless we indicate otherwise, all the data presented here was collected and processed by us. If you want to know more about our methodology, these are a few more details and context for our stats:
Data Collection Period
The data presented in this blog was collected between 2025-04-17 and 2025-04-20, unless indicated otherwise.
Our Sources
All the data presented here is publicly available, mainly though the official Clash Royale API.
From this API we can obtain some basic stats for any users. In this case, the most relevant ones are:
- a log of recent battles
- values for meta progression
- basic metrics, such as amount of battles played and player level
Data Reliability
All the data used for the following stats was obtained through randomised samples, with a precision of around 1 sample for 1,000 accounts.
This allows us to look at macro-trends for the game, but can be limited when looking at events in which the expected amount of players is below 100K. Under that, results of our samples are less likely to be good representations of reality.
The priority of this randomisation was to match account density over time. This means that for any given day, we'd sample an equal amount of accounts.
Although technically we could increase the size of these samples, providing much better accuracy, we'd be sacrificing instantaneity to achieve that. For example, the snapshot could take several days to be taken, instead of just 1 day.
Taking a snapshot over such a long period of time creates other issues, as player behaviour may change significantly from the start to the end of it.
In summary, we chose this sample rate because we think it's a good compromise between size and speed.
Our Limitations
Given that we are using public data, there are some kinds of stats that we don't have access to. For example:
- No direct information for in-game purchases
- No logs of player actions
- No information about users, such as location, device, age or other details
Cleaning Data
Due to how accounts are created in Clash Royale, we need to apply certain filters to help us remove noise.
In short, whenever the Clash Royale app is installed and initiated, it creates a new account that gets added to the playerbase. The prompts for players to log in and resume progress happen afterwards, meaning that a significant amount of accounts are constantly being created and never get to be used.
For this analysis, we aim to get past all these dummy accounts and bots that Supercell uses to facilitate matchmaking. To do so, our main filter is a minimum amount of battles.
Real Accounts:
We consider real players those that have more than 100 battles played, which is equivalent to 5 hours of gameplay.
Bans and Removed Accounts
One of the main constraints of our data collection is that some accounts have been removed from the public API, so for us it will seem as if these players never existed.
Permanently banned accounts fall into this category. Although it's hard to estimate their relevance, our guess is that it is low. Causes for these bans are usually:
- Game exploits
- Repeated disruptive behaviour
- Account sharing
This issues may seem common among competitive players, but less so for the broad playerbase.
In contrast, the server split that happened for China in 2022-03-16 is probably quite relevant. We don't have good stats for these either, but the share of the playerbase may have been around 10%.
Most of these accounts are still active in the local servers, but the international API doesn't have access to them.
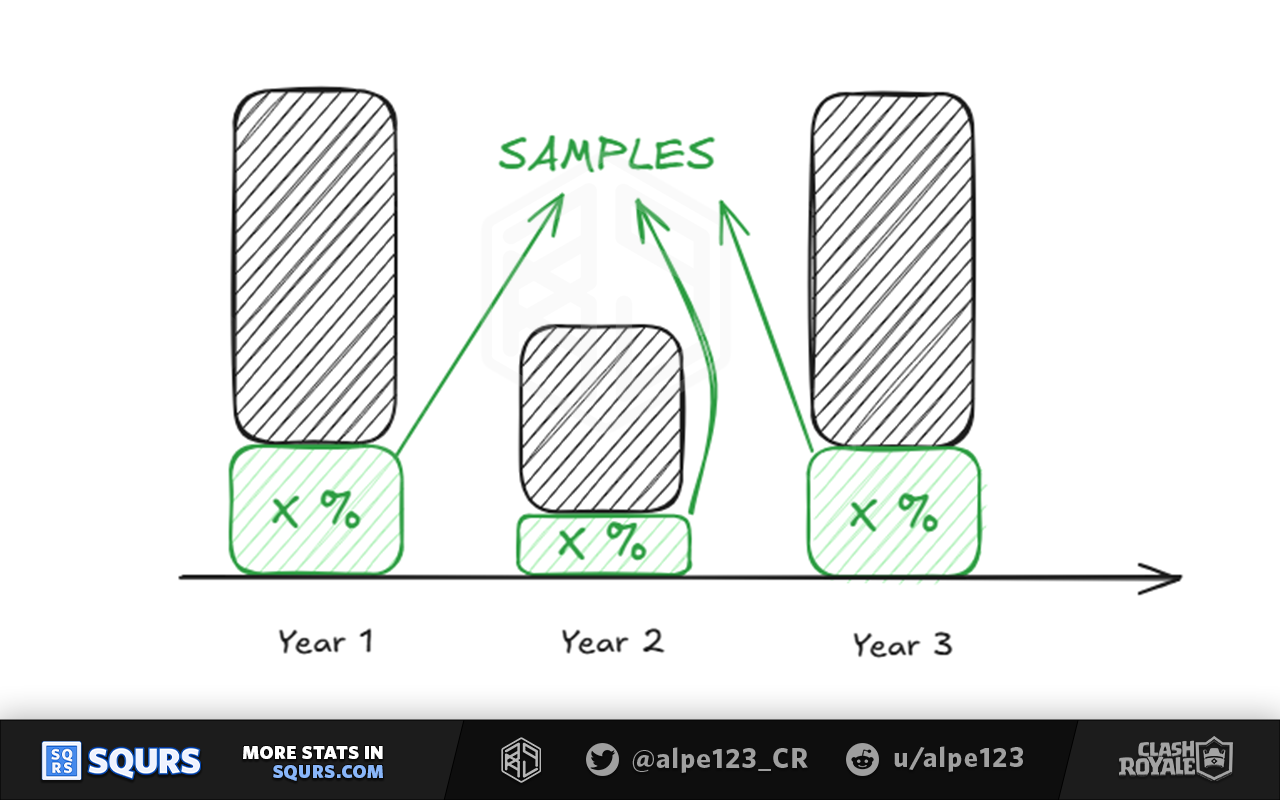
Recent Account Age Estimates
Accounts with less than 1 year of age do not provide a specific age through the public API.
We approximate their age by assuming that the pace of account creations is stable across the recent year. In other words, we know the total amount of accounts created in the past 12 months, but we don't know how they are distributed. We'll assume this distribution is uniform.
This assumption doesn't allow us to look into recent performance, but seems reasonable given that this account creation pace has been fairly stable since 2022 Q2.
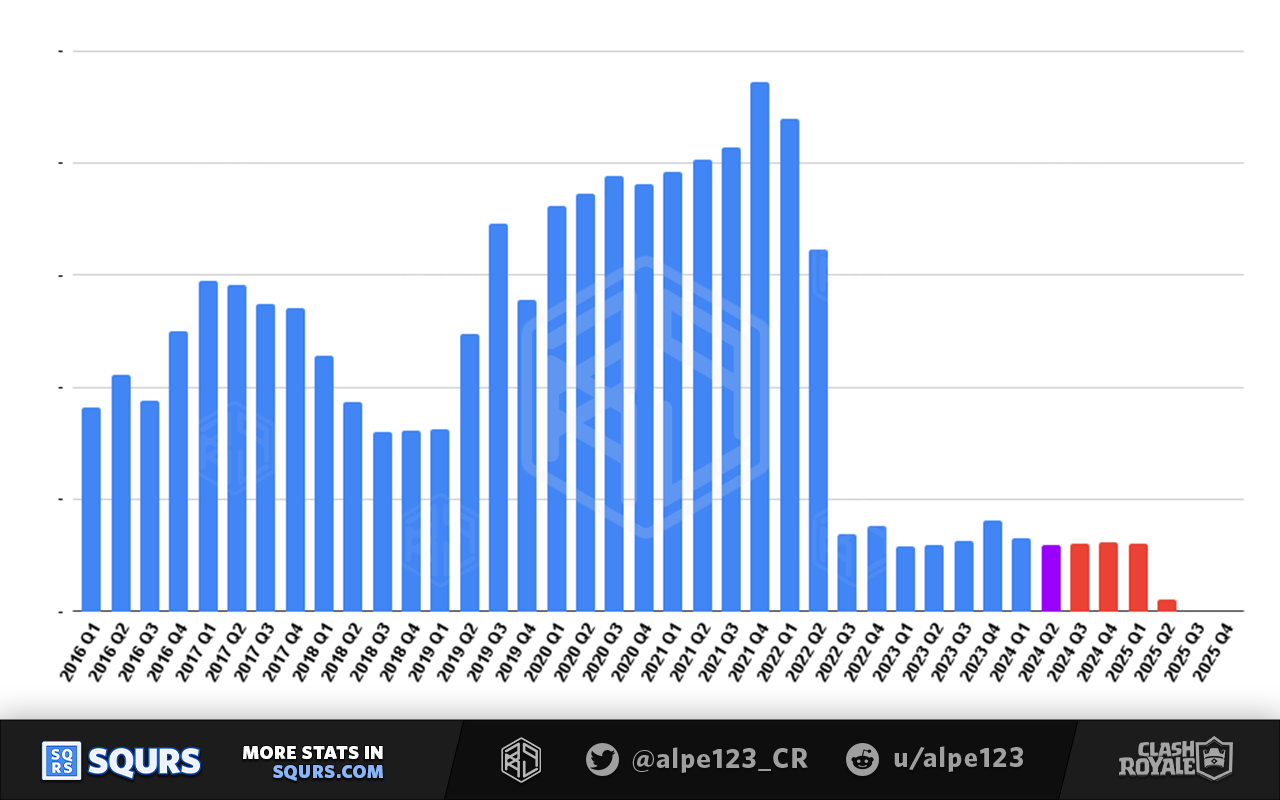
In blue, account creations per quarter, based on real samples
In red, estimated account creations for the last year based on
Current Active Players
Throughout this blog, we'll look at many different ways to group players, trying to get a sense of what the playerbase looks like as a whole.
Before we go down a handful of rabbit holes, we'd like to show you one of the simplest and most important charts from our results: the active players.
Clash Royale is going to be 10 years old fairly soon, and despite the negativity that spills over from subreddits and social media, it's still looking strong.
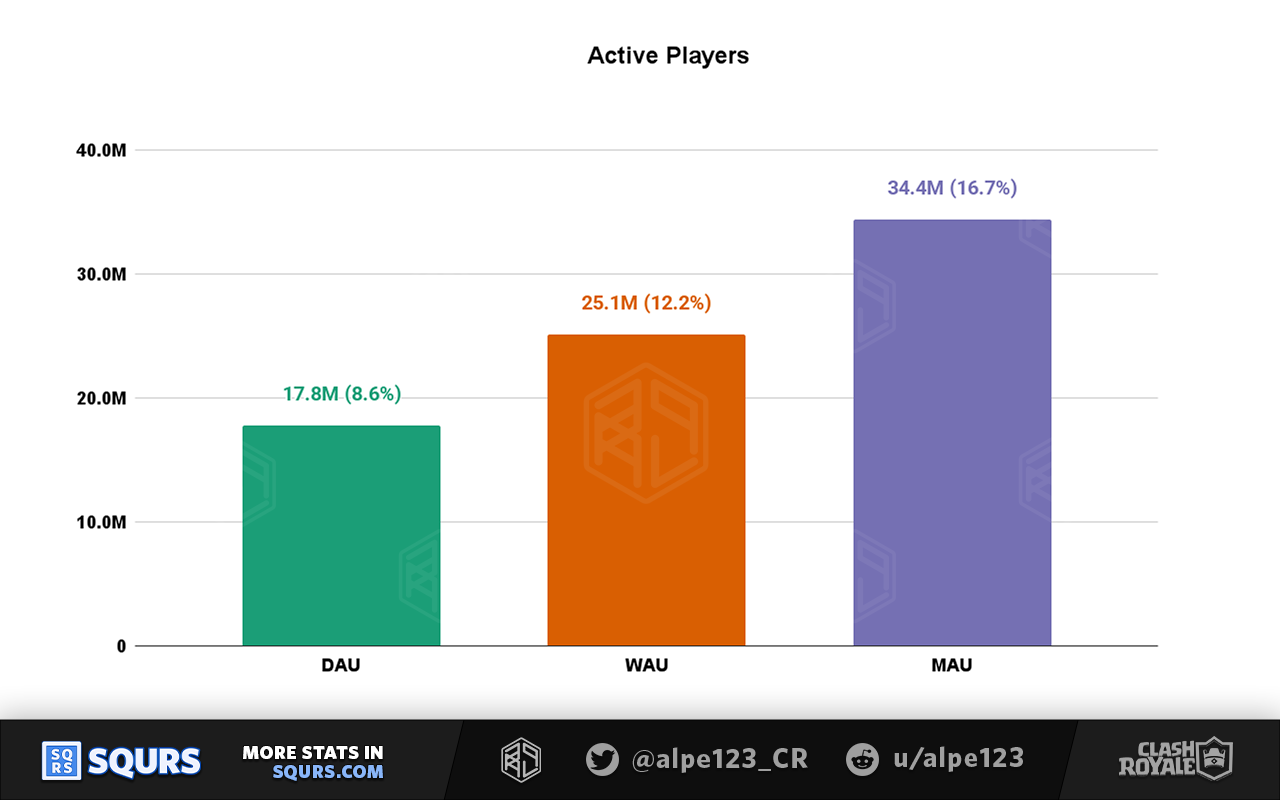
These are the core stats from our playerbase snapshot:
- Daily Active Users (DAU) 17.8 Million Players
- Weekly Active Users (WAU) 25.1 Million Players
- Monthly Active Users (MAU) 34.4 Million Players
Early Days
The most known timeline for Clash Royale's release is:
- 2016-01-04: iOS soft-launch
- 2016-02-16: Android soft-launch
- 2016-03-02: iOS and Android global-launch
However, the game had been live for some time before these soft-launch events became official. The oldest know account dates back to early December (2015).
The oldest account
scoopr is now an inactive account. The creation date was 2015-12-03.
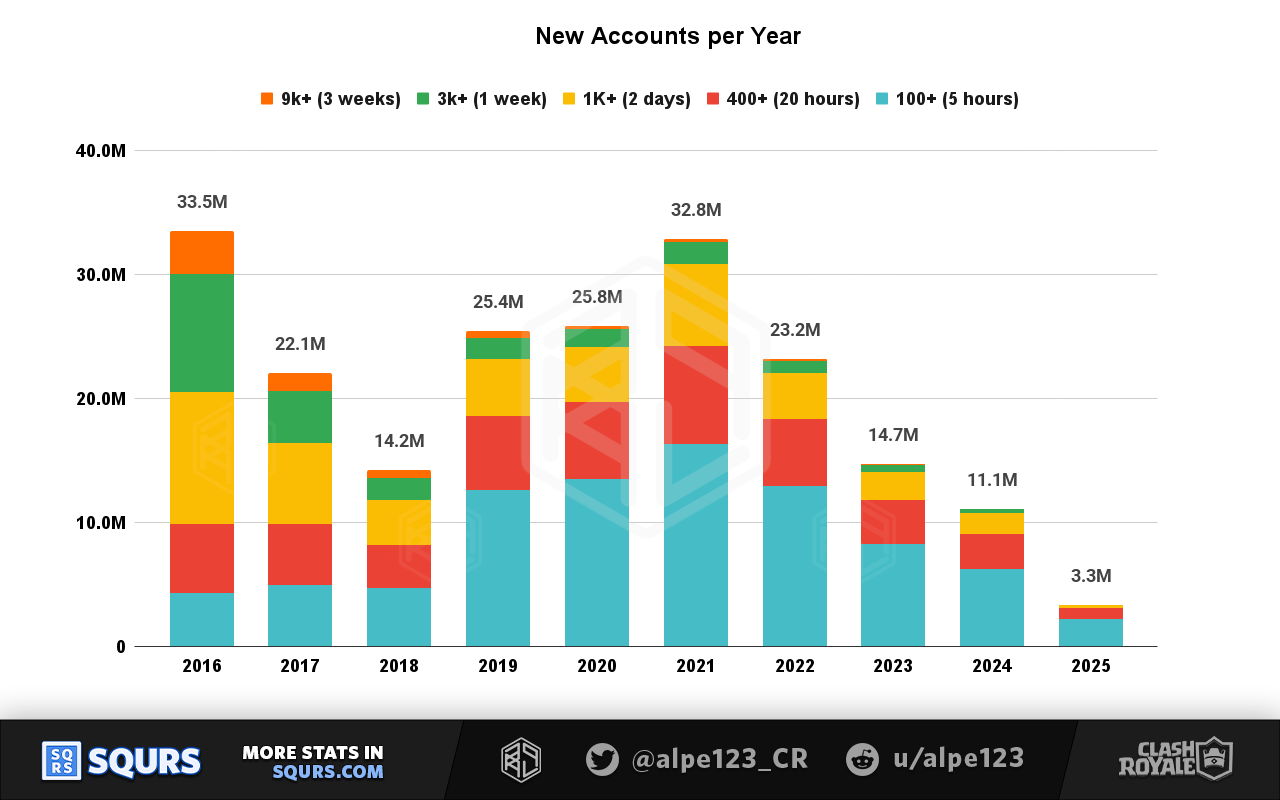
Annual Overview
This blog will mainly base charts and stats on quarterly performance, which is better aligned with update cadence. This annual overview is a basic introduction that should make following details easier to understand.
The amount of created accounts peaked in 2016, with the game release. In 2021, that peak was almost improved due to an outstanding Q4.
Created accounts can be used as a proxy for user acquisition (UA). We don't have the means to separate paid from organic UA.
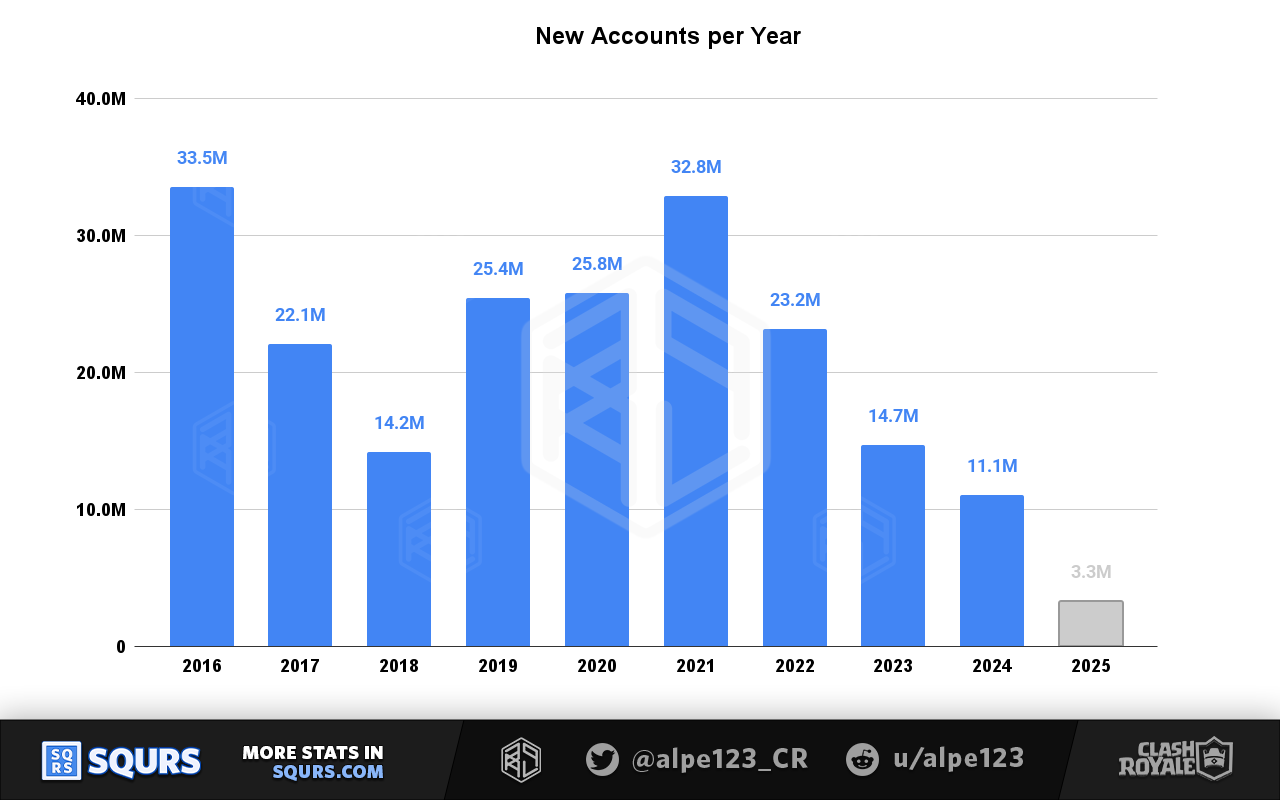
As we mentioned in the introduction, new accounts need more than 100 battles to be considered real players to be displayed in this chart. This means that these aren't just app installs, but users who engaged with at least 5 hours of gameplay.
Long Term Engagement
We can look closer at this level of engagement, and see how many players engaged even more with the game. We have separated all these created accounts into 5 tiers of engagement:
- Beginner between 100 and 400 battles (5-20 hours)
- Basic between 400 and 1K battles (20 hours - 2 days)
- Advanced between 1K and 3K battles (2 days - 1 week)
- Veteran between 3K and 9K battles (1-3 weeks)
- Expert more than 9K battles (3+ weeks)
Percentage-stacked chart
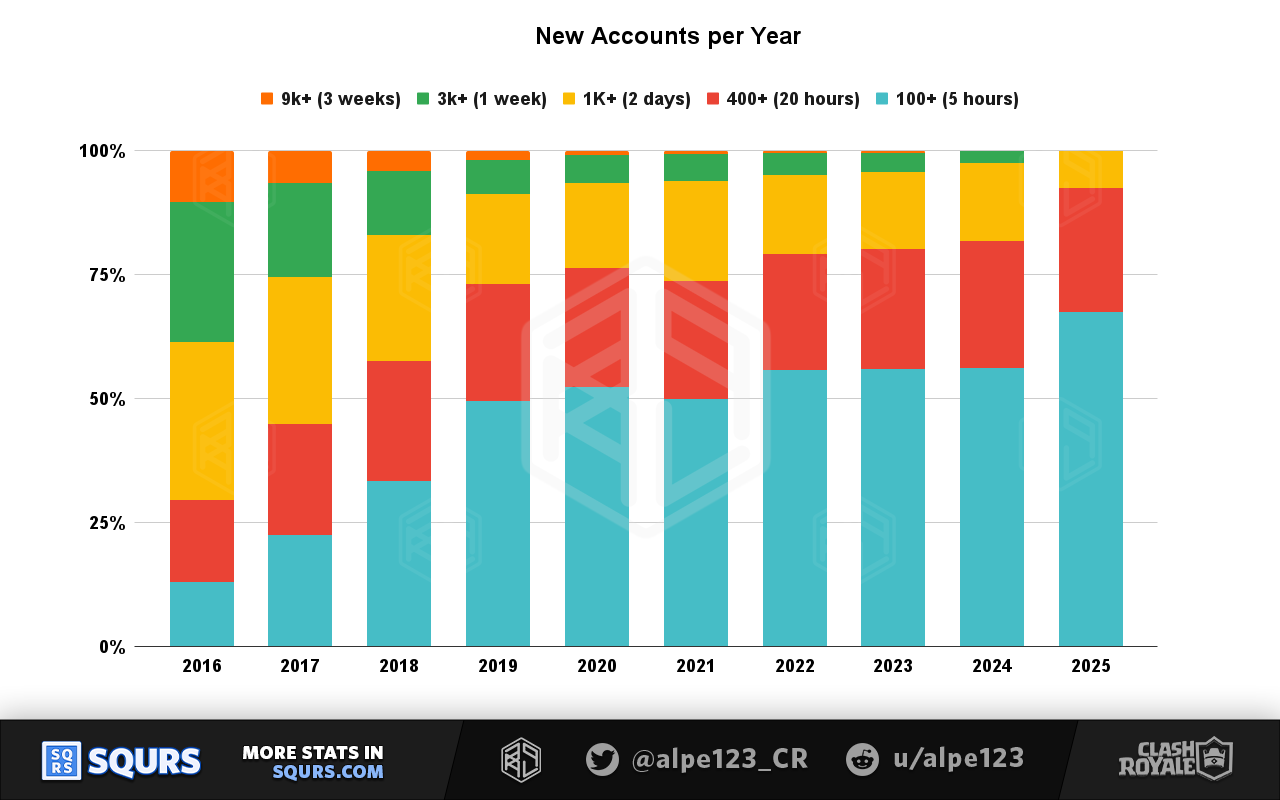
It's worth noting that this metric can make it seem as if older players are more engaged, but part of this is due to aggregated play time. E.g.: a very casual player that joined in 2016 may have more hours played than a very hardcore player who joined in 2024.
Active Users
There are many ways to measure player engagement. Based on segment duration, there are 3 main alternatives:
- Daily Active Users (DAU)
- Pros: useful to see how many players are very engaged with the game, close to habit behaviour
- Cons: very irregular for Clash Royale, and very dependent on player types. E.g.: some casual players may only play during weekdays, a few minutes at a time; more active players may grind during weekends
- Weekly Active Users (WAU)
- Pros: quite good overall, as it removes these day-by-day changes. Weekly patterns are fairly predictable and steady over time
- Cons: vulnerable to spikes produced by seasonal content
- Monthly Active Users (MAU)
- Pros: aligned with seasonal content, so it arguably provides the best overview of the current engagement level
- Cons: harder to distinguish casual from regular players
We can use these 3 tiers of active players to see what the active playerbase looks like currently.
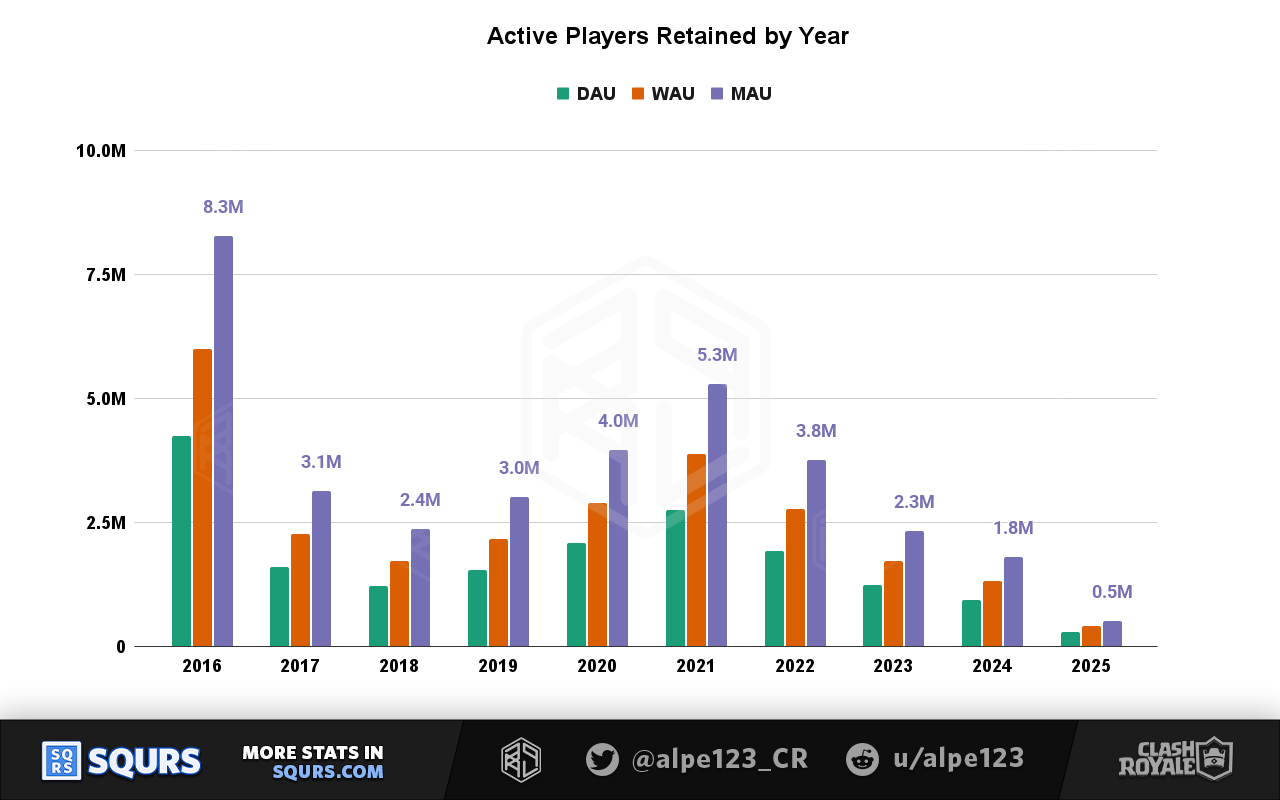
It's also relevant to see how this relates to the total amount of players acquired each year. In other words, what share of players has been retained and remain active users in the present?
From the initial batch of players, who joined the game when it was released (in 2016), 25% have been retained. This cohort has remained specially faithful through the years, and stands out when compared to the rest. For all the years afterwards, the share is lower, consistently around 15%.
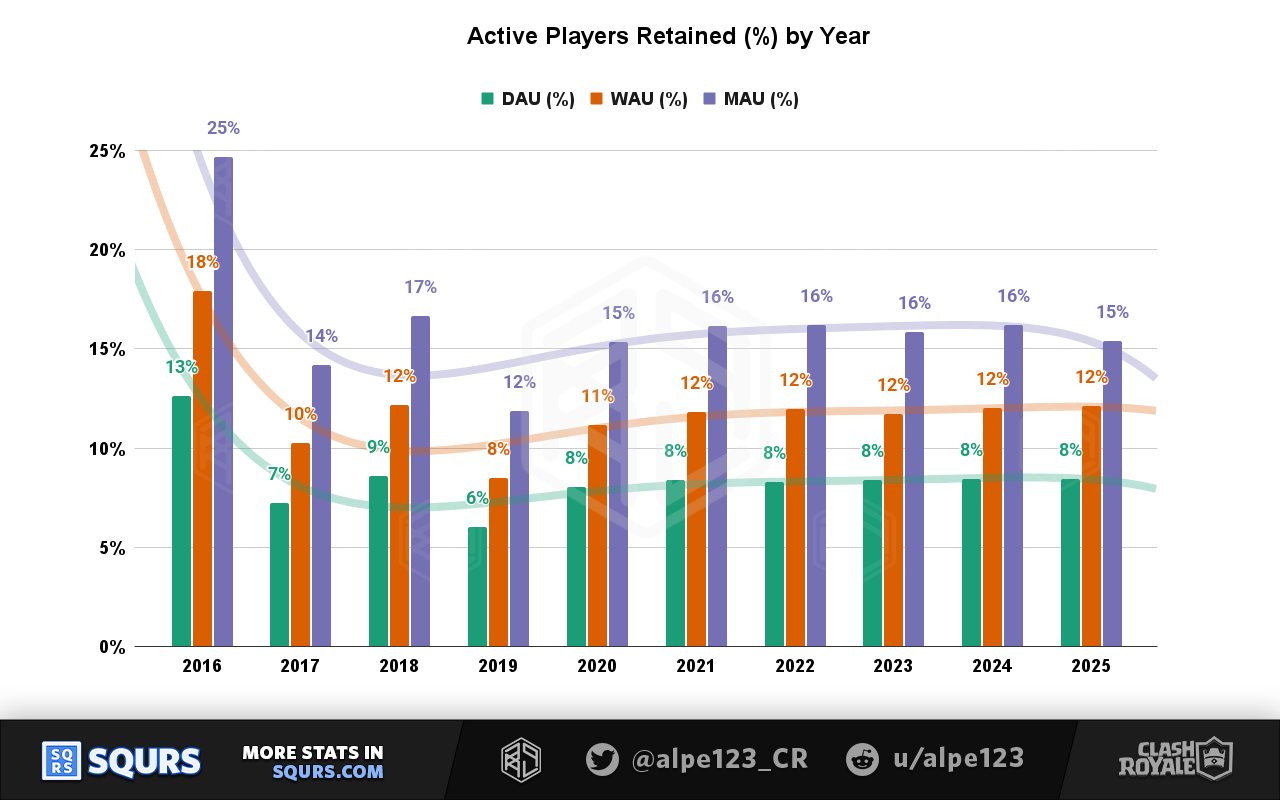
What are retained player shares?
To calculate these shares we use the amount of real players from each year.
For example, the share of retained MAUs is:
Retained MAU (%) = MAU / real players (%)
Key Insights
Of all the players who download Clash Royale and play 100+ battles, around 15% become permanent regular players.
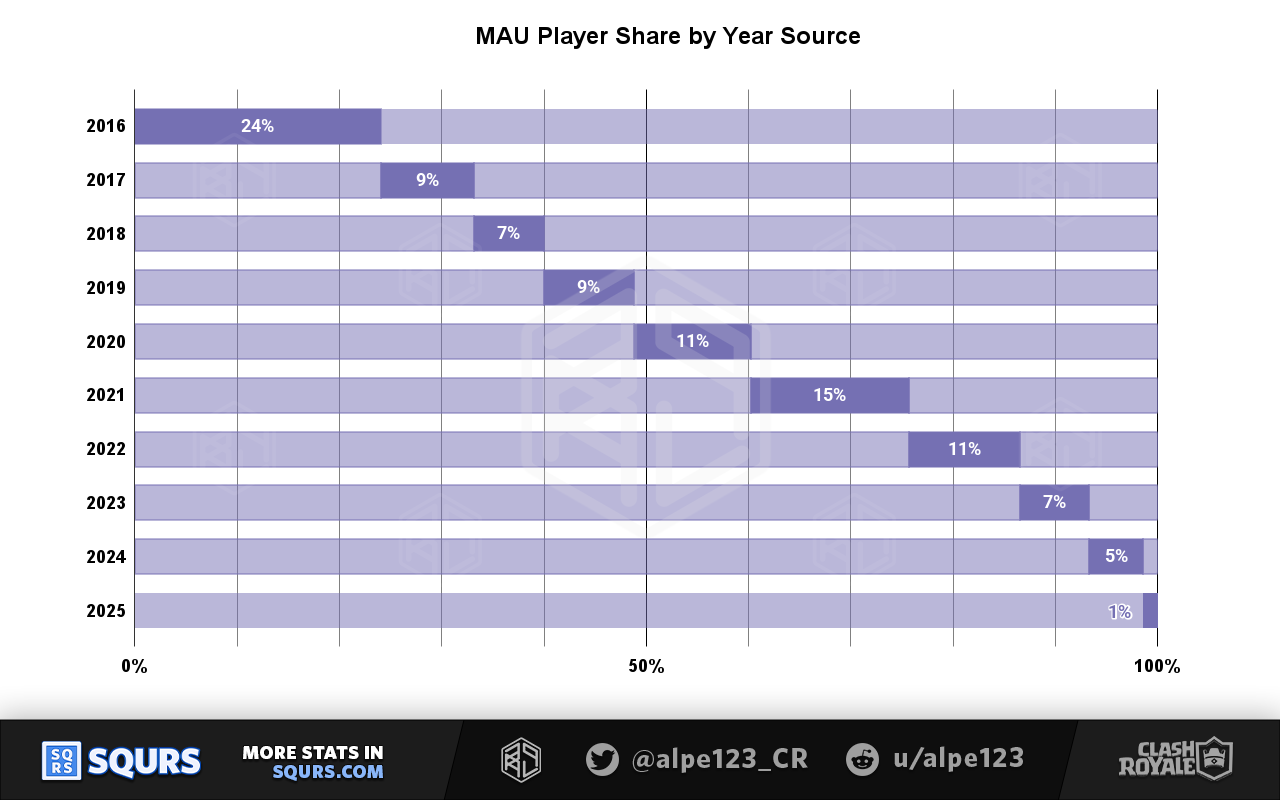
How relevant are all these retained players over the years for the current active playerbase?
By transposing these MAUs, we get a better sense of the age mix of these active players.
New players are a very small minority, and their size has been in consistent decline since 2021. As we showed earlier, the retention rate has remained fairly stable, so the reduction in user acquisition seems to be the main cause for this decline.
DAU and WAU charts
The analogous distribution charts for DAU and WAU are almost identical:
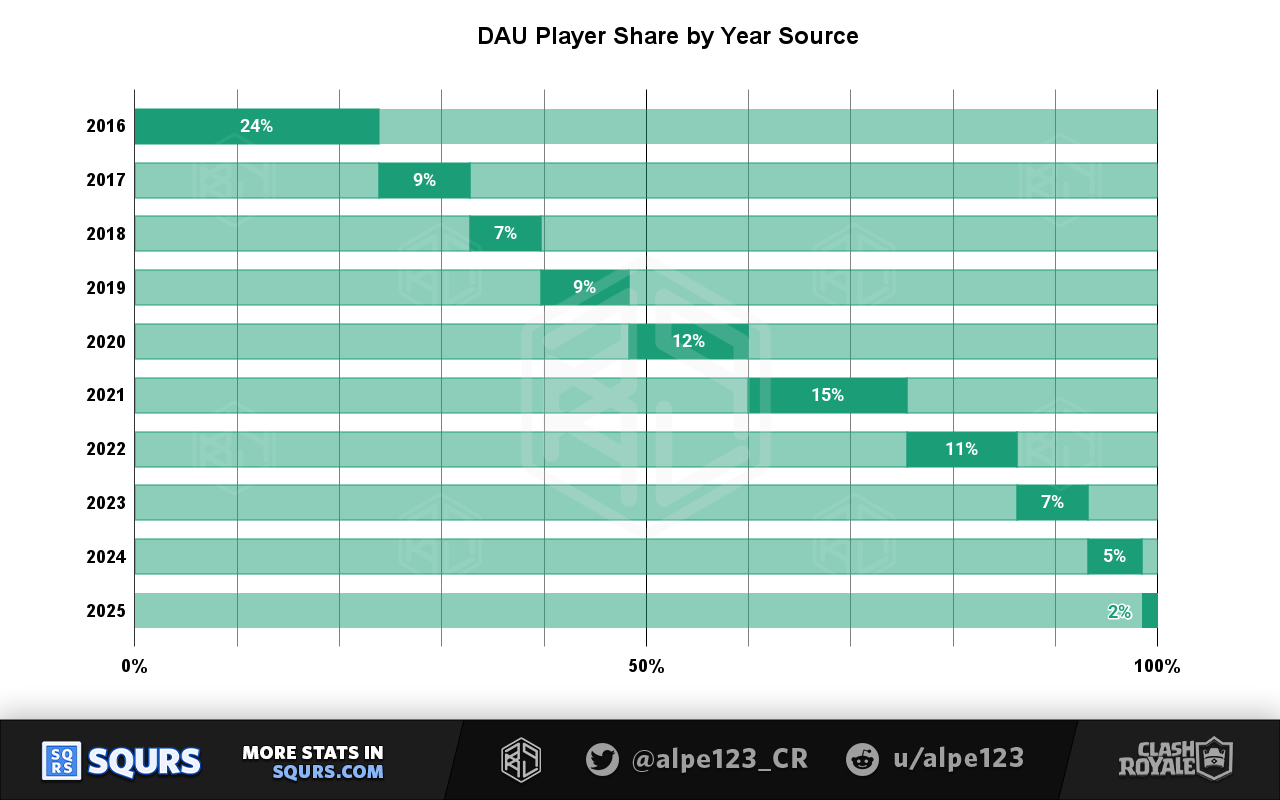
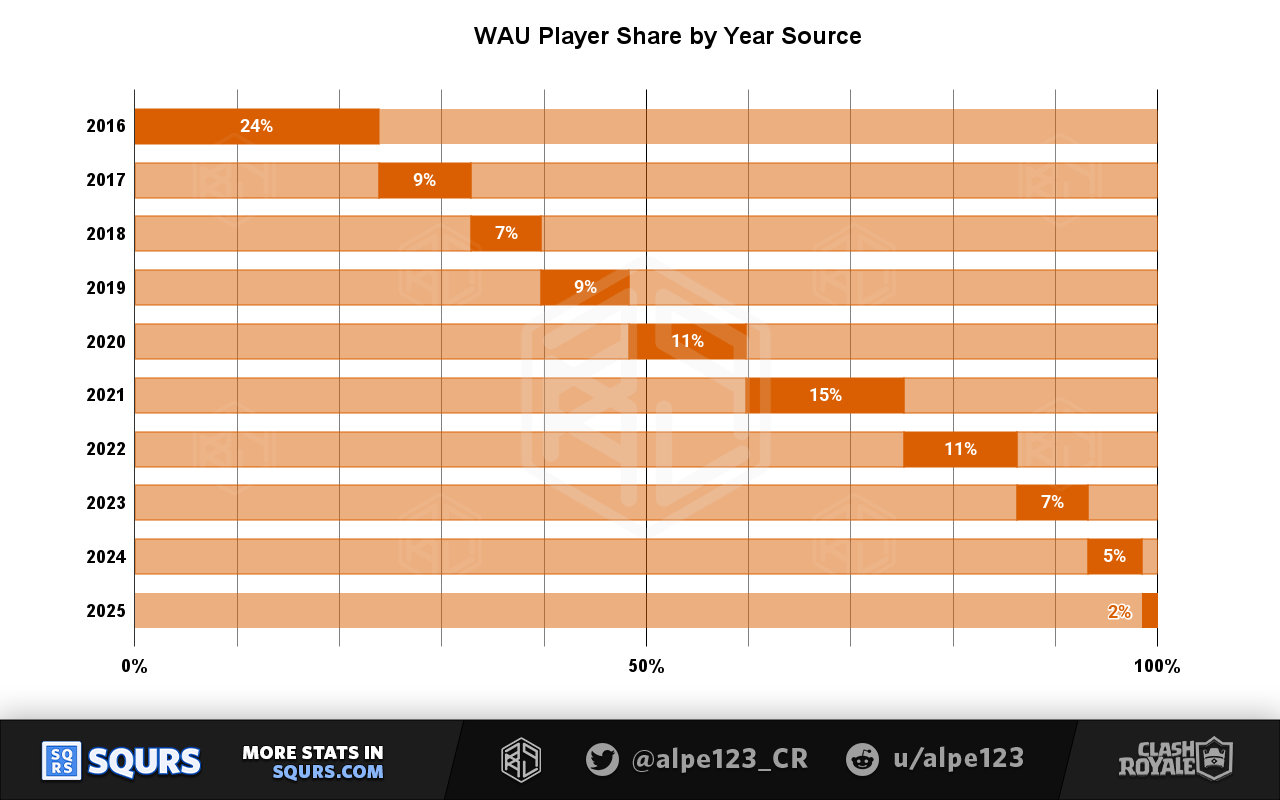
Key Insights
About half of the active playerbase joined before 2020. The other half started playing in the last 5 years.
New Players VS Google Trends
One of the most common ways to review game performance over time is to look at Google Trends. This is probably the case due to its simplicity and free access, but how reliable is it?
Google Trends: Clash Royale
For Web Search, this is what the relevance chart looks for the main searches related to the game:
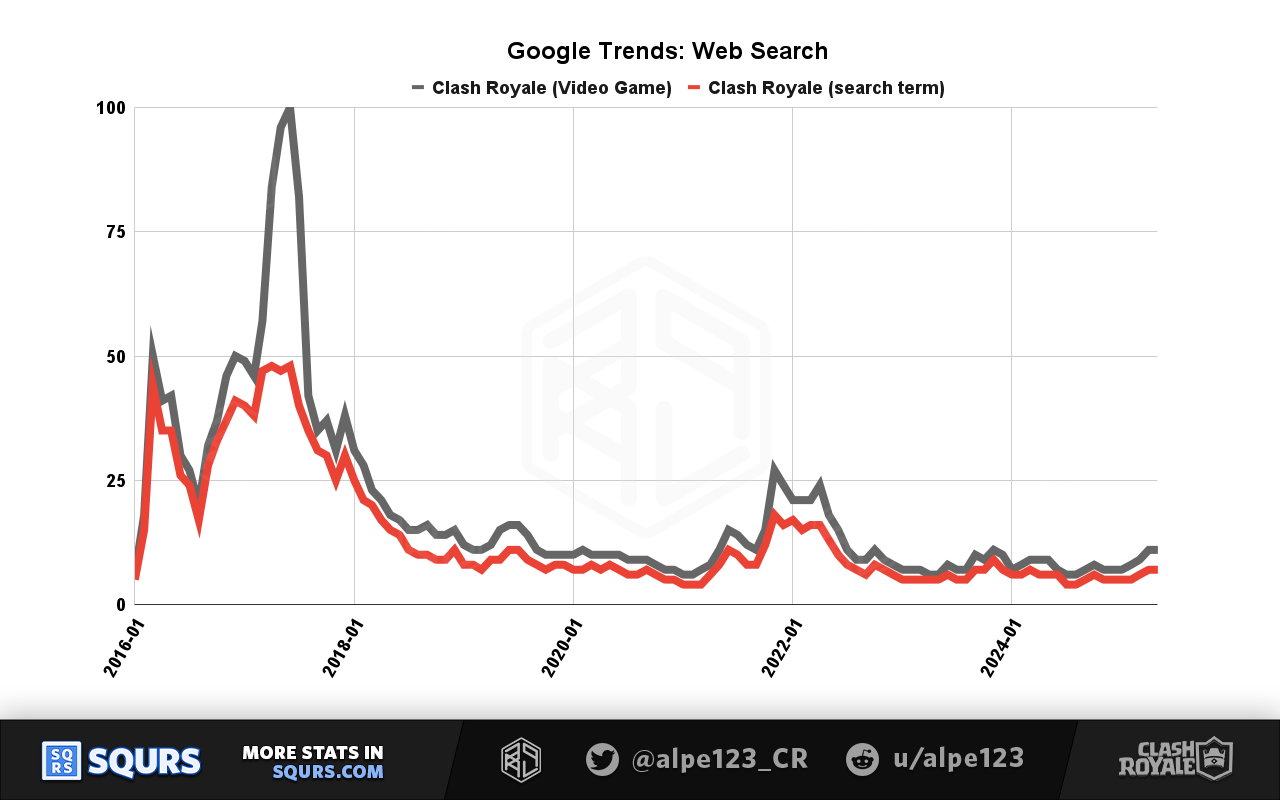
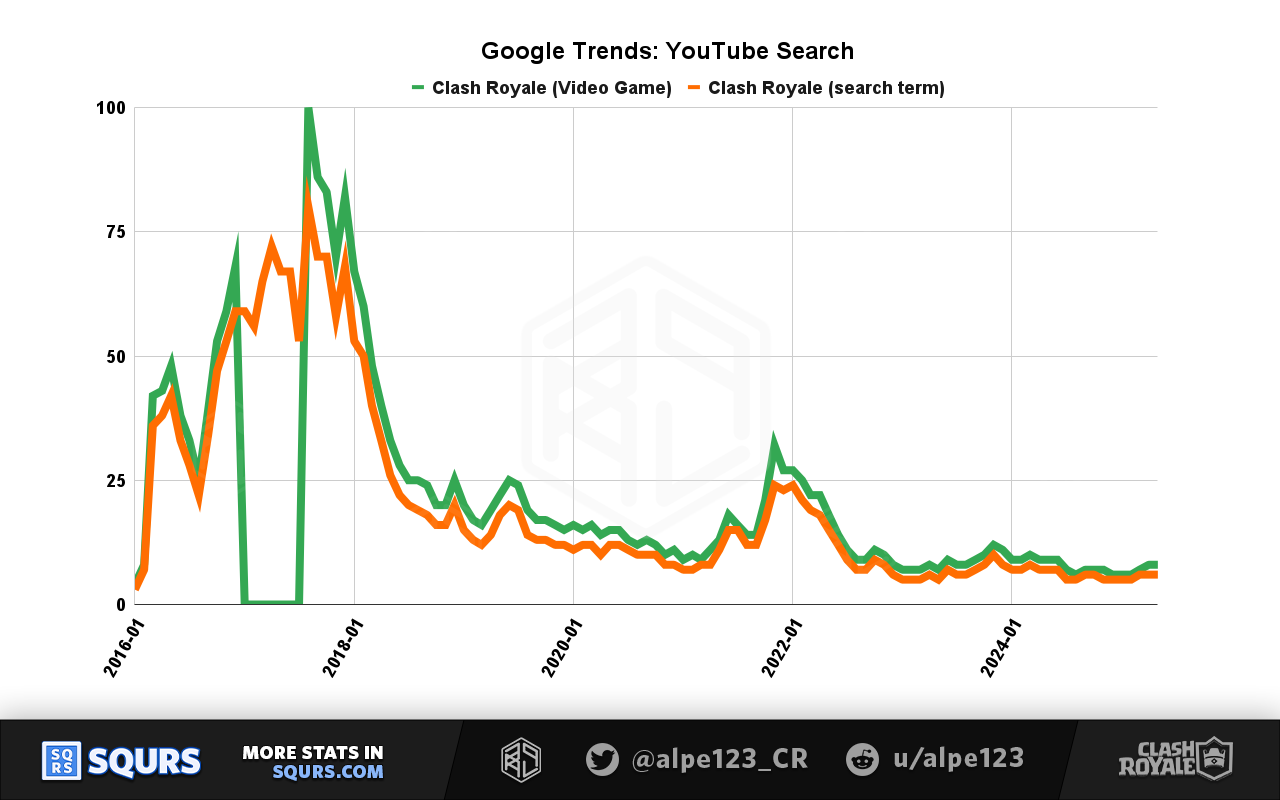
It's unclear to us which game metrics should map best to search patterns, mainly because it's also unclear what kind of user is creating these searches.
- Non-players finding out about the game?
- Non-players looking for game-related content?
- Active players looking for game-related content?
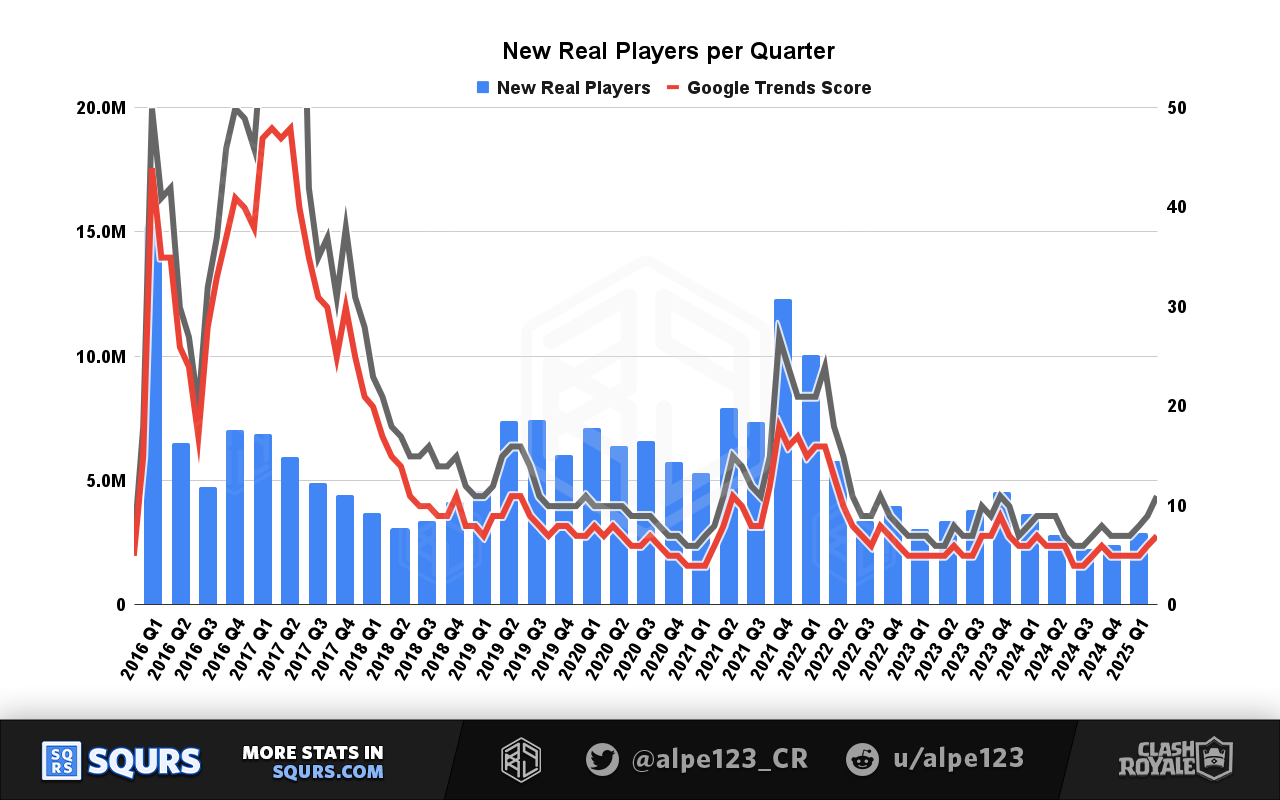
If it's the last of the three, active users over time could be a reasonable comparison. Unfortunately that's not data that we can obtain from a present-time snapshot, so we'll compare it to the amount of new real players over time.
The results have a surprisingly good resemblance for recent years, but look hardly related if we look back past 2021.
We do see a better fit if we disregard values, and simply look at trends. Upwards trends in search popularity match the time periods in which account creations increase, and vice versa.
Trophy Road
This is the main mode of Clash Royale, and "trophies" are the score that measure progress in it. Trophies increase when a battle is won, and decrease with losses; similar to an Elo rating.
Trophy Road ranges from 0 to 9,000 trophies, and is the core limitation for basic progression. This path is divided into Arenas, which provide different themed environments and allow players to unlock new troops.
Although for advanced players this stage of the game may seem trivial, more than 99% of players are below the 9,000 trophy limit.
All Real Players
This is what the distribution looks like for the whole playerbase:
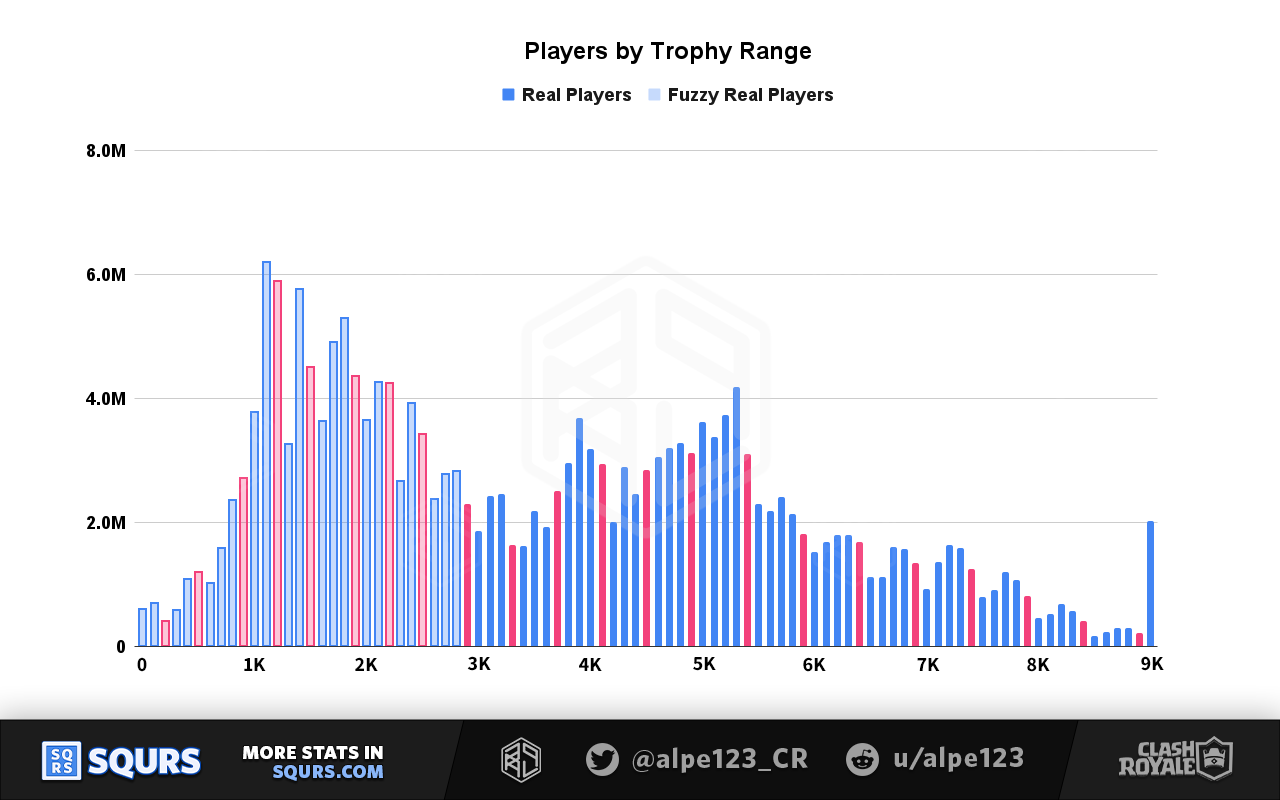
Fuzzy Players
Due to one of our initial filters to find human players, the minimum of 100 battles, the lower end of this player distribution is very unreliable.
Players usually get ± 30 trophies for each win/loss, so after 100 battles, all players are expected to remain under 3,000 trophies.
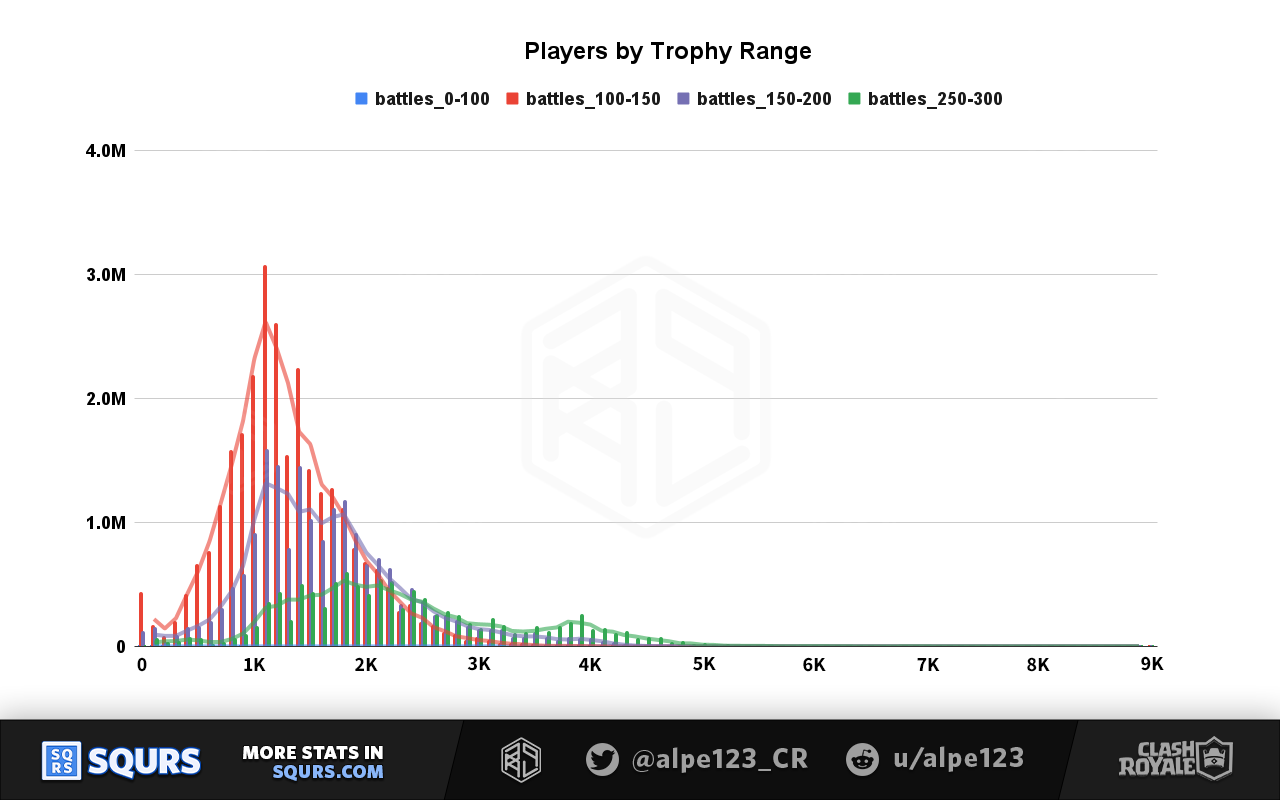
In order to show this is true, here you can see some very small player segments directly above 100 battles:
- 100-149 battles
- 150-199 battles
- 200-249 battles
The first of these, in red, has a distribution that peaks at around 1,200 trophies. The amount of players who get past 3,000 trophies with this amount of battles is negligible.
In any case, these players with less than 100 battles played cannot be considered a relevant part of the playerbase.
Key Insights
There are 2 million players that have completed Trophy Road, by reaching 9,000 trophies.
A player who reaches 9,000 trophies is among the top 1% players with more than 100 battles played.
Trophy Gates are highlighted in red. These gates are the limit to reach a new arena, and trophies can't be lost below them, acting as a rank floor.
Trophy Road has changed a lot over the years. For example, the trophy limit used to be well below 9,000 trophies when the game was released:
- 2016: 3,000 ➜ 4,000 trophies
- 2021: 4,000 ➜ 5,000 trophies
- 2022: 5,000 ➜ 7,500 trophies
- 2023: 7,500 ➜ 9,000 trophies
As players leave the game before these changes affect their behaviour, this distribution is mainly shaped by those old limits that no longer exist.
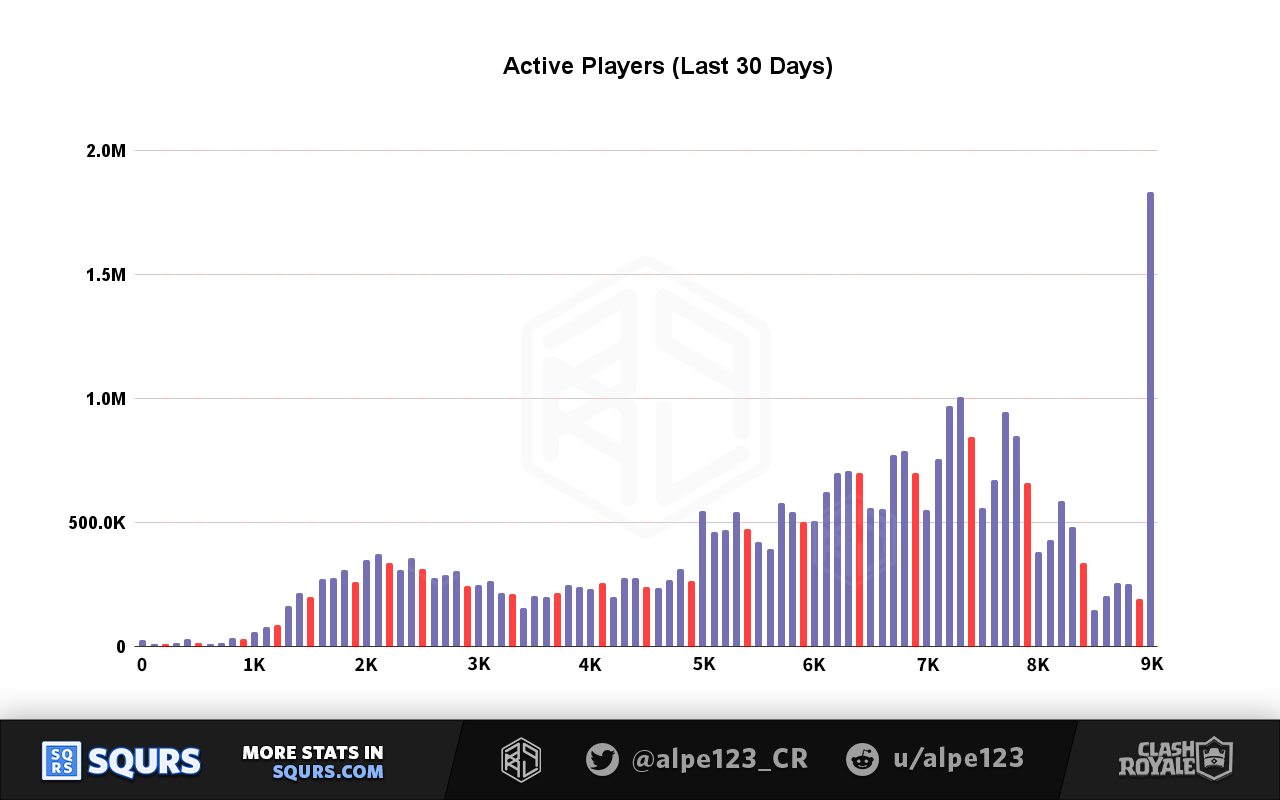
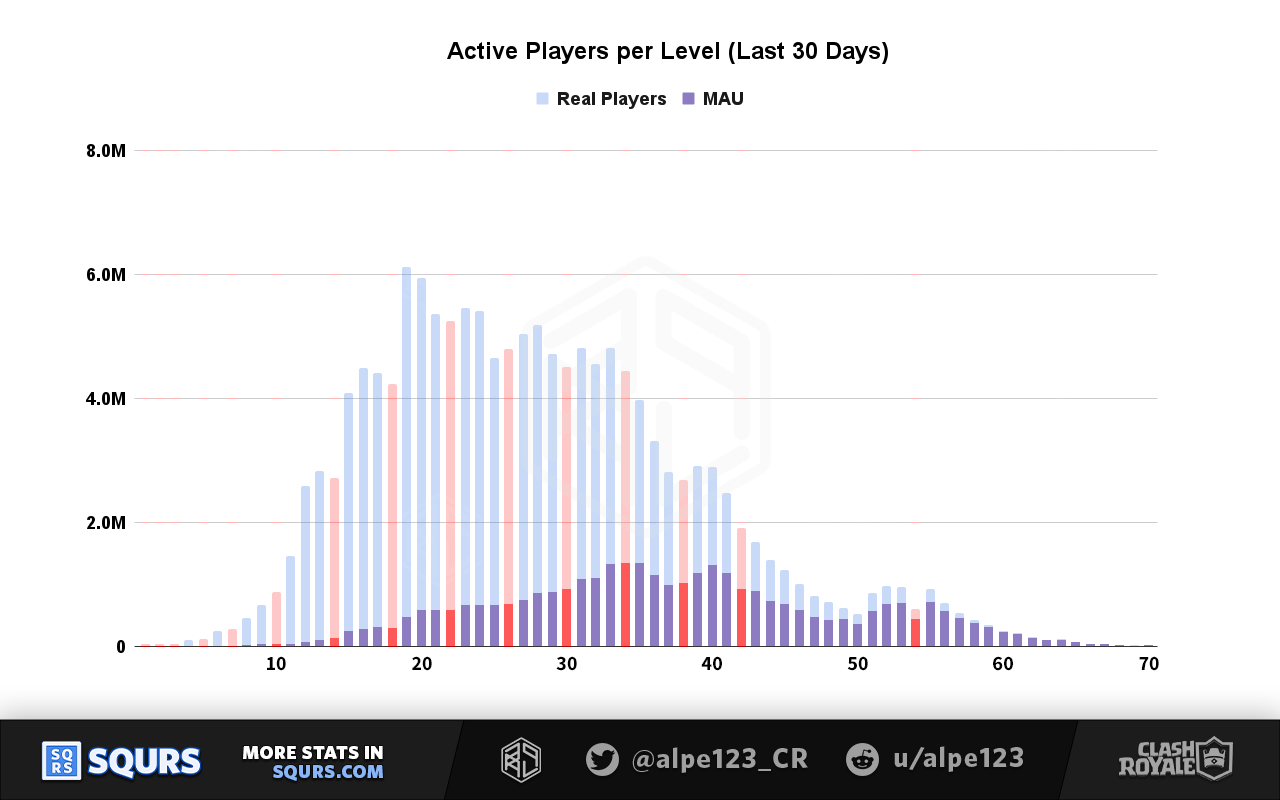
Monthly Active Users
Current Trophy Road design affects current players, so let's look at the distribution of players who were active in the last month.

Share of MAU chart
This chart contains the same distribution shown above, but stacked to 100%.
The changing trophy limits heavily distort this distribution.
For example, a player who has more than 7,500 must have played since 2023. This makes it very likely that they are currently an active user.
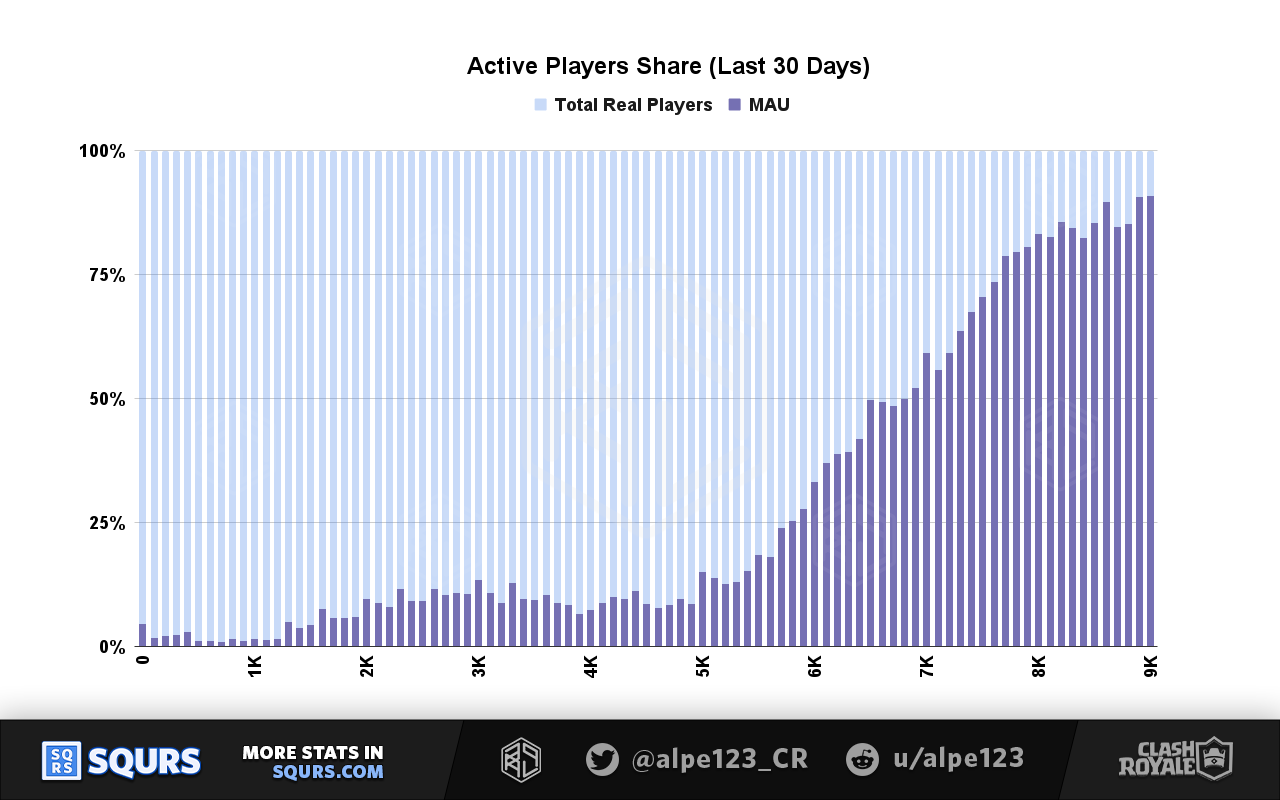
Key Insights
For the segment of active players, reaching 9,000 trophies means you are among the top 7%.
In this distribution, the presence of Trophy Gates is much more visible. Players pile up before them, due to the increased difficulty. After the gate, players spread away due to the trophy generation caused by the rank floor.
In lower arenas, these effects are less visible, probably due to the overwhelming presence of bots. These bots help players steadily increase their trophy scores, avoiding the frustration created by hitting a rating walls.
MAUs grouped by battles played
Progression in the Trophy Road is highly correlated with the amount of battles played by each player.
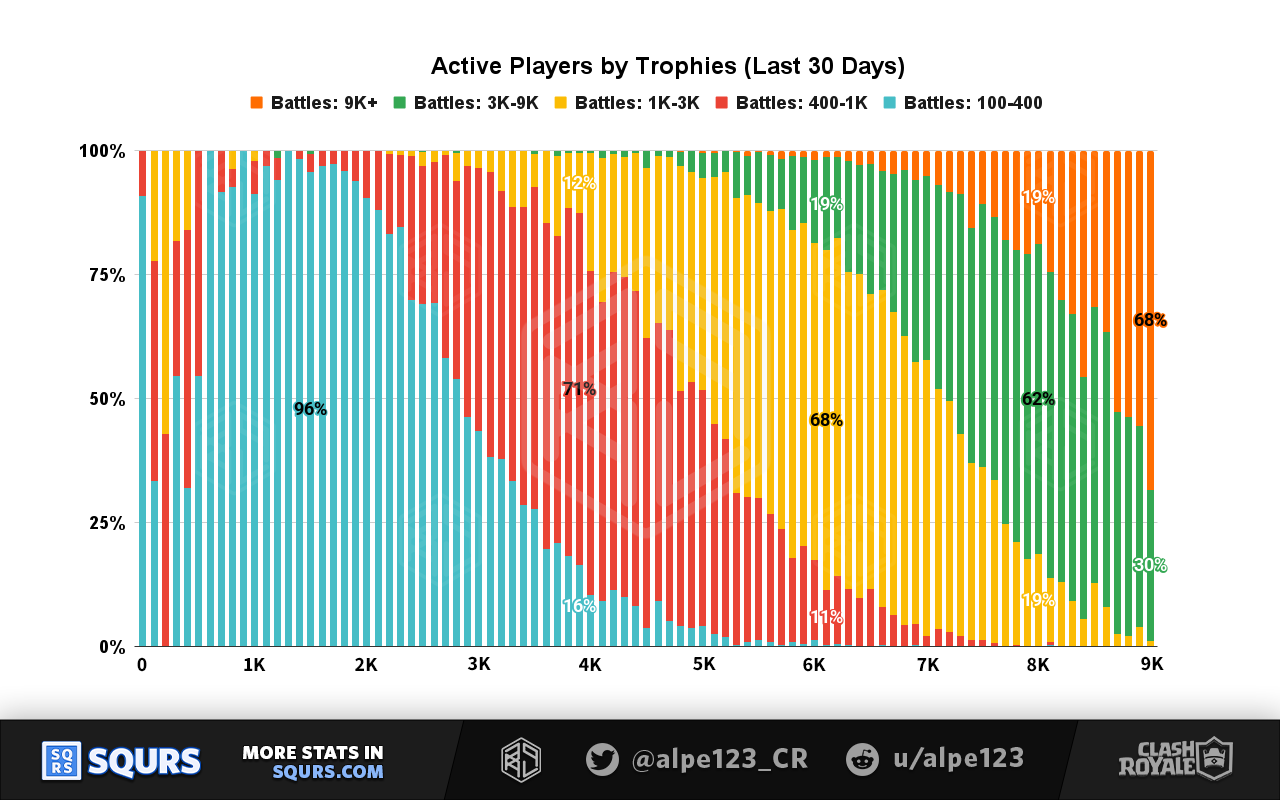
Battle Ranges
We introduced these 5 battle ranges earlier:
- Beginner between 100 and 400 battles (5-20 hours)
- Basic between 400 and 1K battles (20 hours - 2 days)
- Advanced between 1K and 3K battles (2 days - 1 week)
- Veteran between 3K and 9K battles (1-3 weeks)
- Expert more than 9K battles (3+ weeks)
Count distribution chart
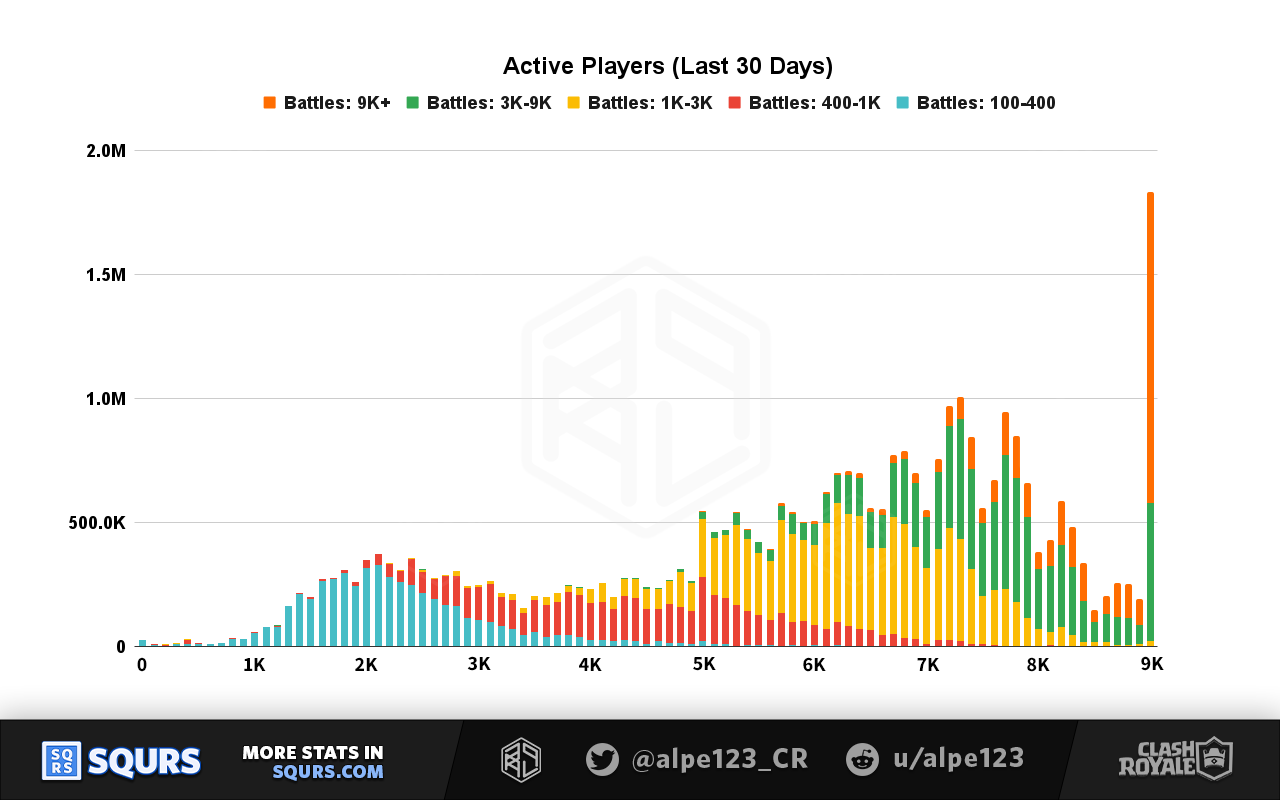
Key Insights
Mostly all players need more than 3K battles played to complete Trophy Road (9,000 trophies). That minimum of 3K battles is equivalent to 1 week of gameplay (170 hours).
MAUs grouped by age
In contrast, the share distribution when players are grouped by account age is much more even.
- New players, from 2024-2025, skew towards low trophies
- Old players, from 2016-2017, skew towards high trophies
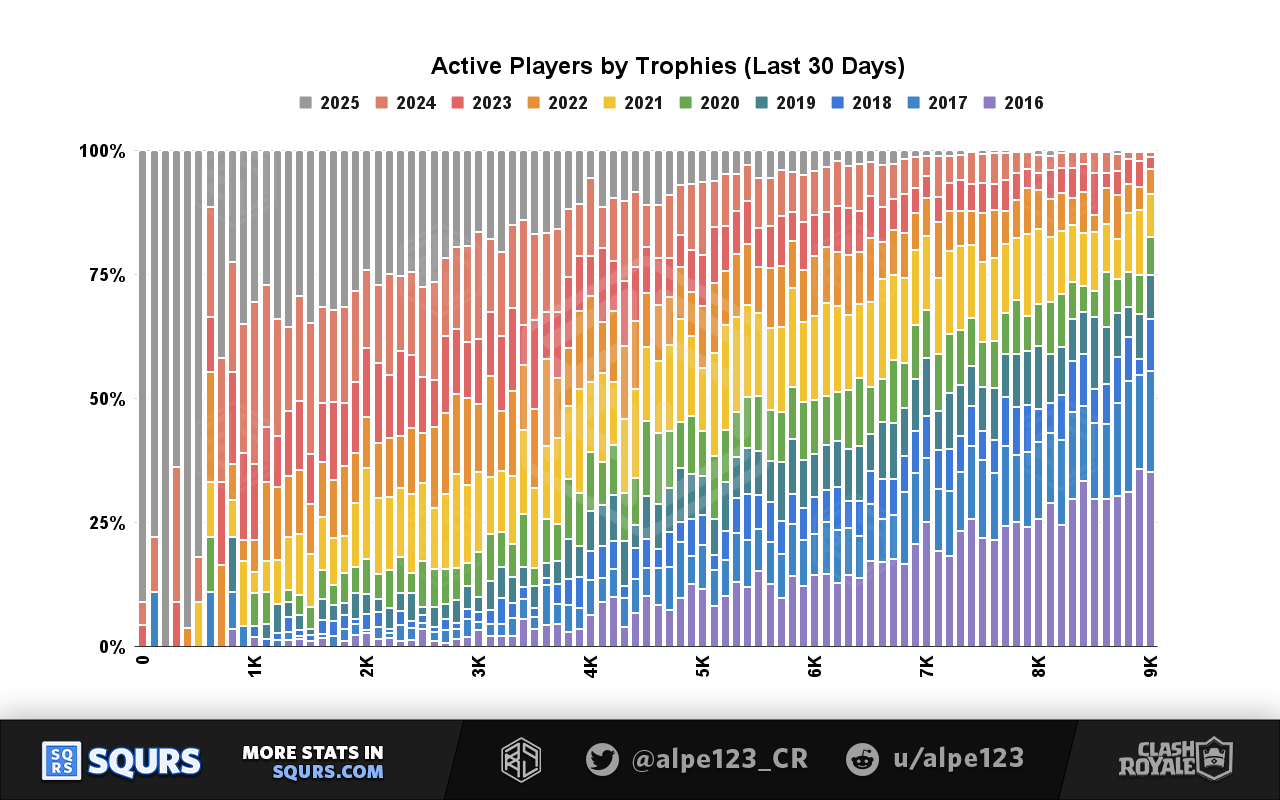
In summary, player progression in Trophy Road is mainly linked to time played, and not account age.
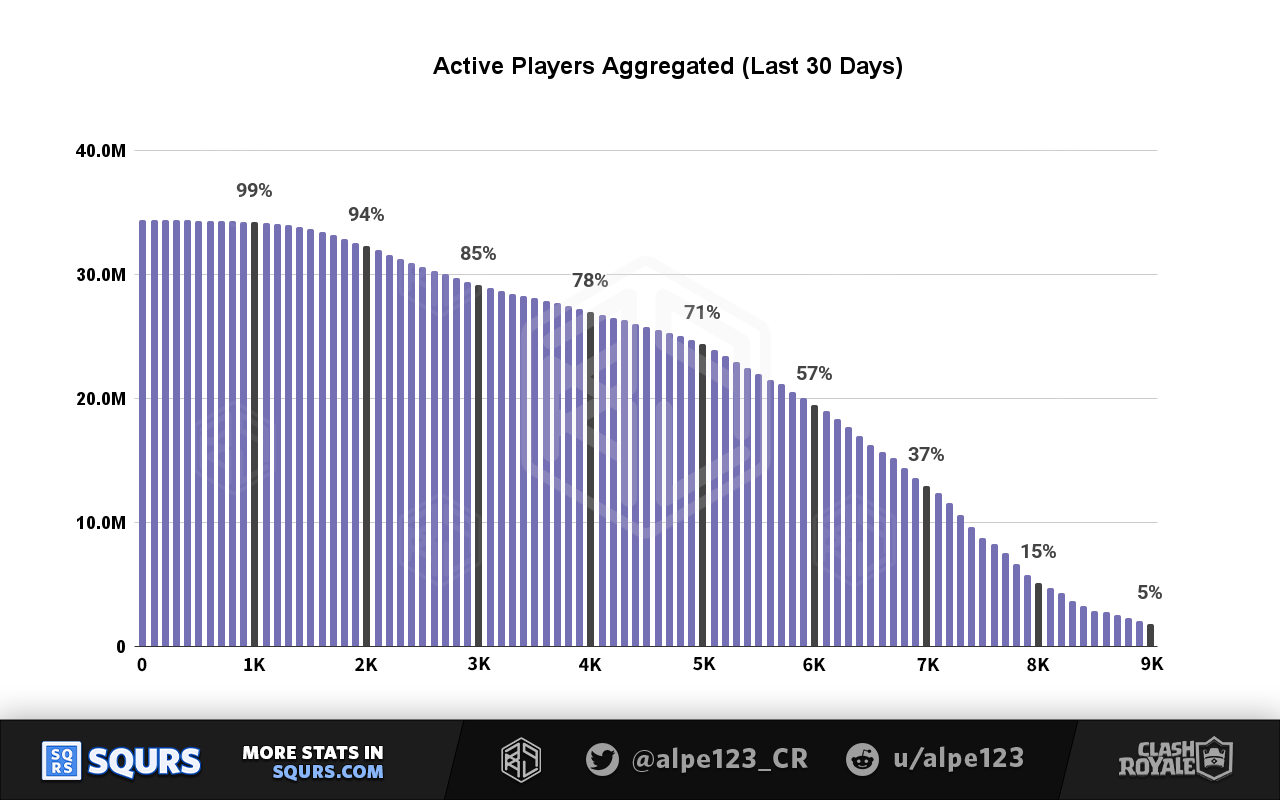
MAUs aggregated
Lastly, another way to look at this distribution is with a descending aggregation.
This allows us to visualize how many players are above each trophy range. For example:
- 71% of MAUs are above 5K trophies
- 5% of MAUs have reached 9K trophies
Path of Legends (PoL)
This game mode was added to the game in 2022, and is the main alternative to Trophy Road. It's based on seasonal progress, which resets every month.
The first stage is based on 9 different leagues, in which progress is measured by steps. Similar to the Trophy Gates, this mode also has rank floors, but due to the monthly resets, they aren't as relevant for the long term.
After completing the 9 leagues, players reach the second stage, which is a ranked mode without rank floors. Hardcore players regard this mode as the main showcase of their strength, and compete to obtain good ranks in the seasonal leaderboards.
Given the seasonal nature of this mode, looking at a live snapshot of the playerbase isn't going to provide very relevant results. It's better if we look back at previous seasons, and see where players ended up by the end.
Best PoL Seasons
The following charts label each of the PoL leagues with a number.
- 0 is equivalent to not participating
- Players start in league 1
- League 10 is equivalent to reaching the ranked stage of PoL
PoL is unlocked at 5K trophies
The non-participation, shown as League 0, is due to the limited access to PoL.
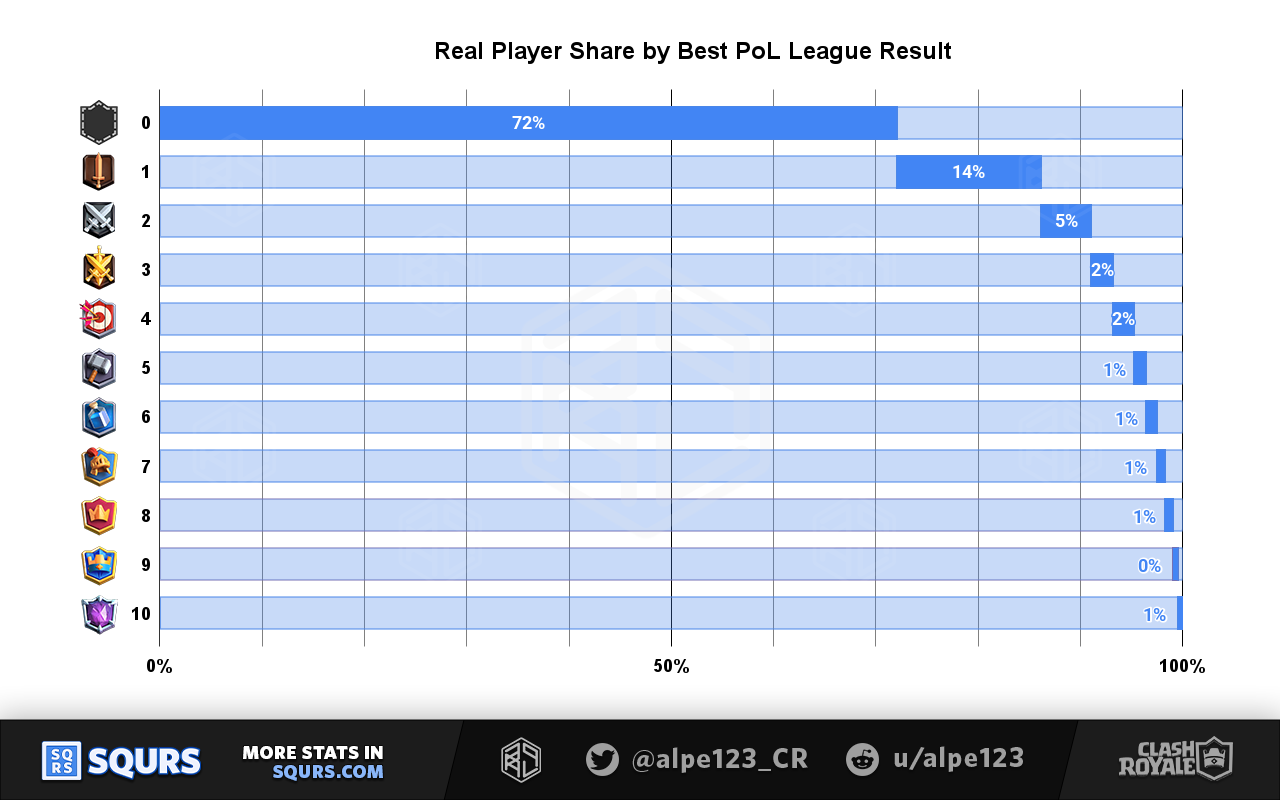
Basically, ~70% of players haven't reached 5K trophies, so they don't have a best season.
The League 1 results are a better reflection of the lack of interest towards this mode, as these players have unlocked it but never moved past it.
Distribution by trophies chart
This chart shows the total amount of players that has reached each league.
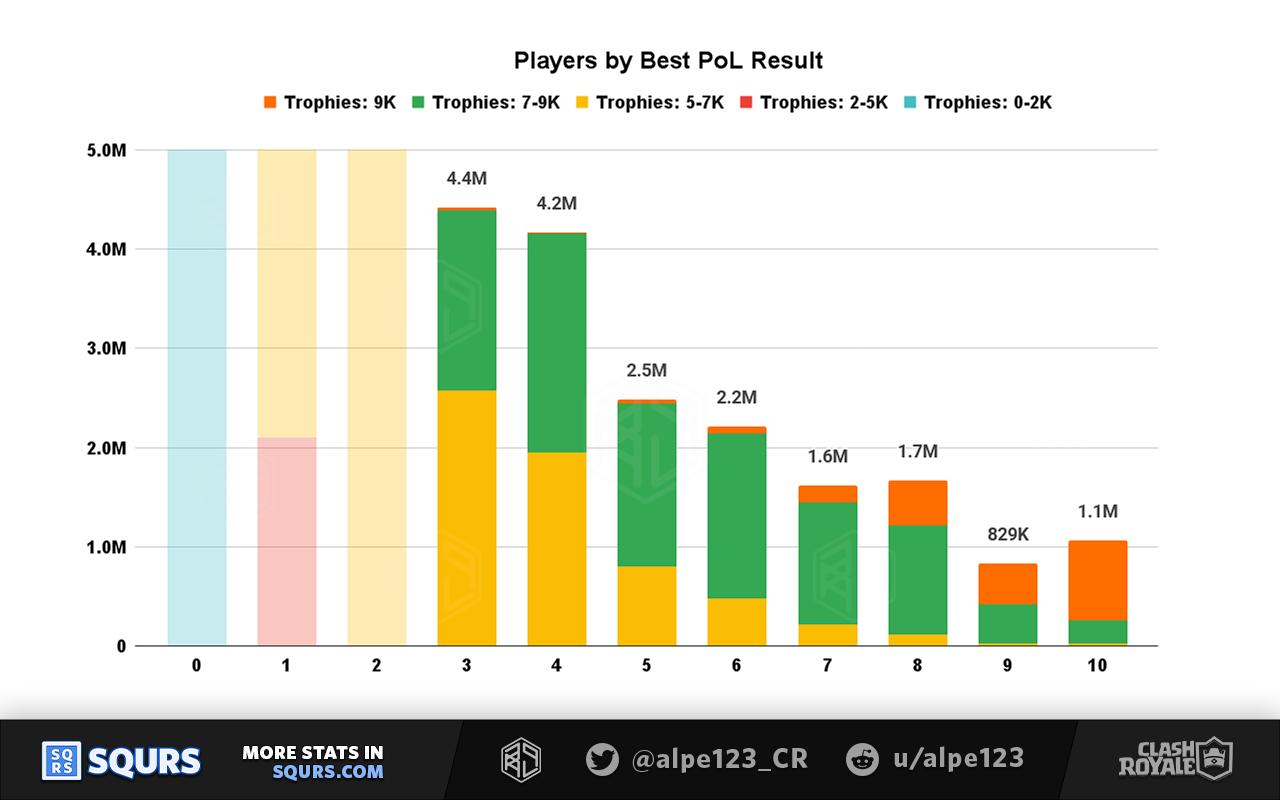
Most (76%) of the players that have reached Ultimate Champion have also completed Trophy Road (9,000 trophies).
Key Insights
Of the whole playerbase, 1.1 million players have reached Ultimate Champion at least once.
This distribution shows that a significant share of the playerbase hasn't meaningfully engaged with this feature.
As far as we know, Path of Legends doesn't have bot accounts like Trophy Road does. What it does have is a "Golden Step" mechanic, which ensures that players can advance regardless of their win rate. If a player hasn't moved past League 1, it can be attributed to a lack of interest, rather than underlevelled collection or skill issues.
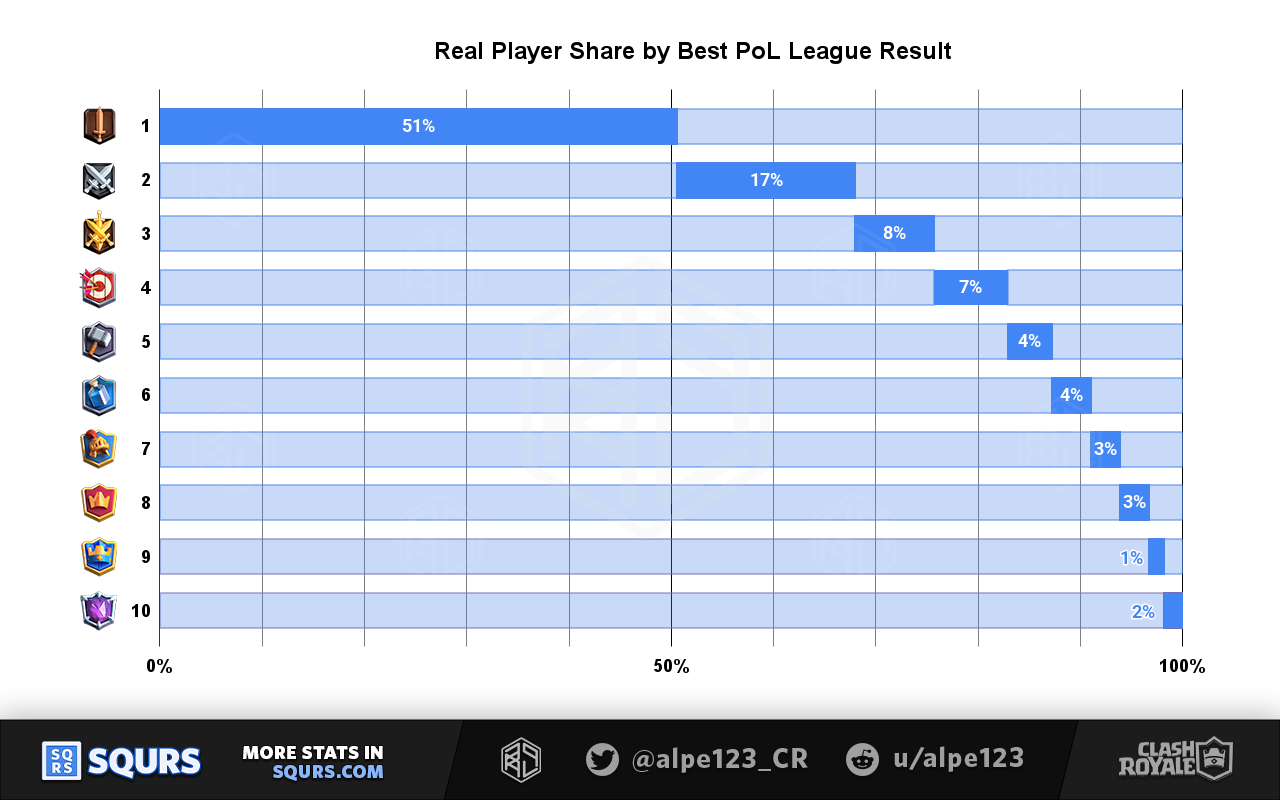
The analogous chart for active users shows better participation rates. This implies that players who left the game were less likely to care about this mode.
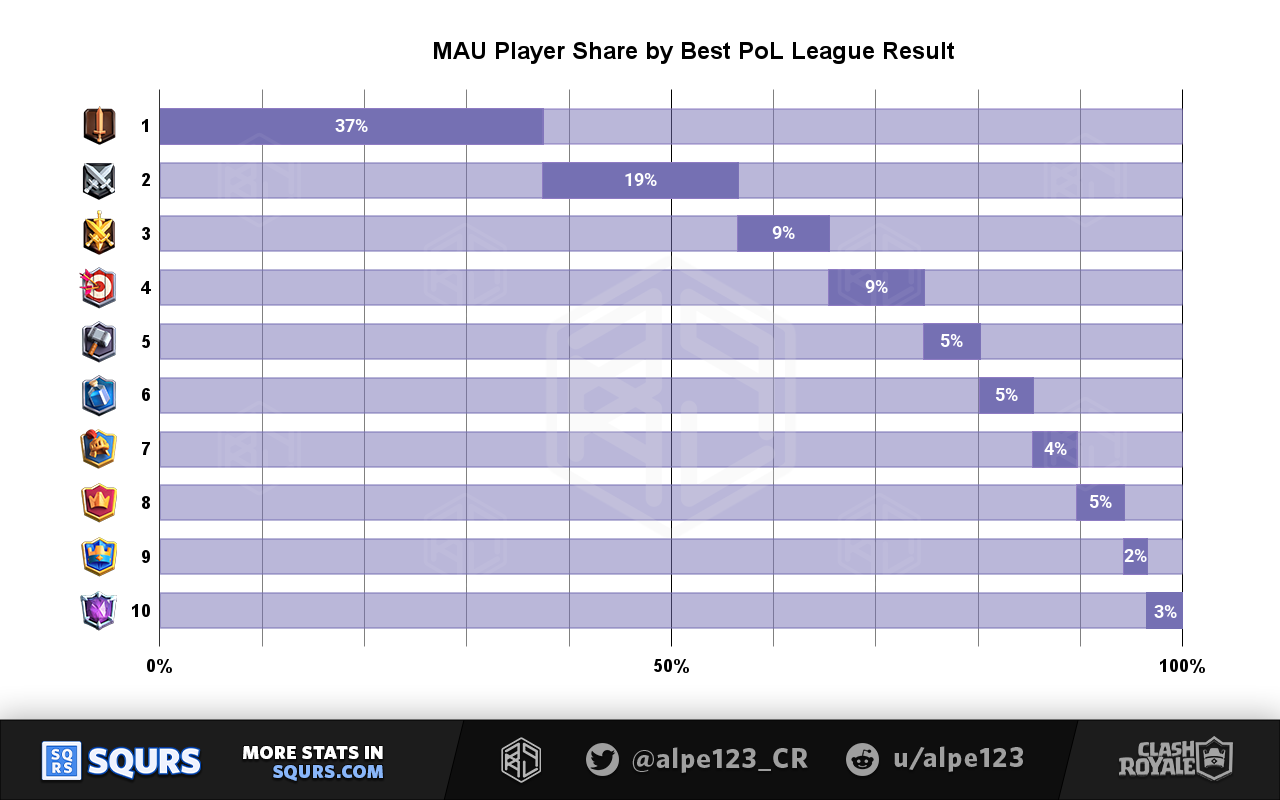
Key Insights
From the monthly active players with more than 5K trophies, 37% have never completed League 1 of Path of Legends.
Who doesn't play PoL?
A good way to look into each of the segments of the previous chart is to group players by amount of battles played.
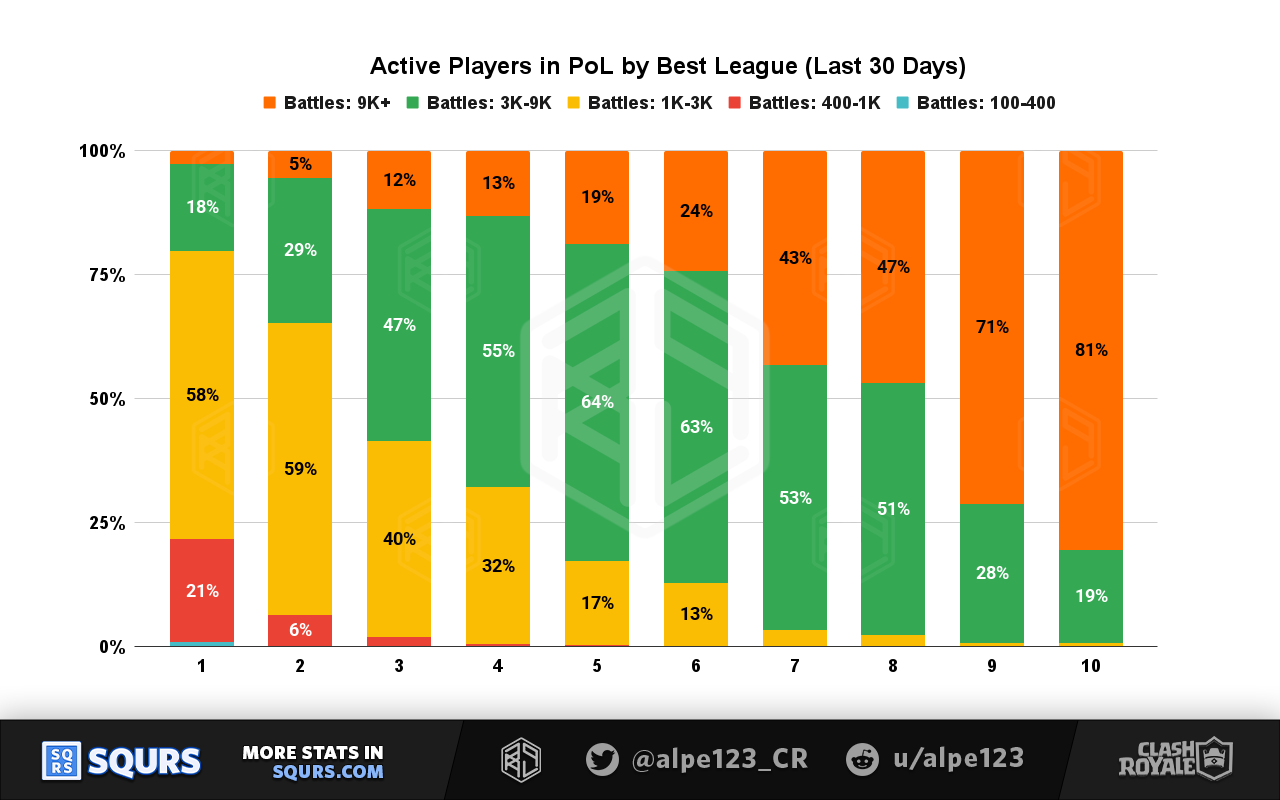
This shows that players who haven't completed League 1 are mostly players with low play time. They probably haven't completed Trophy Road, so trying alternative modes isn't appealing yet.
This can be seen more easily if we group players by their trophies from Trophy Road
Players with 9,000 trophies mainly have a PoL result of League 6 or higher.
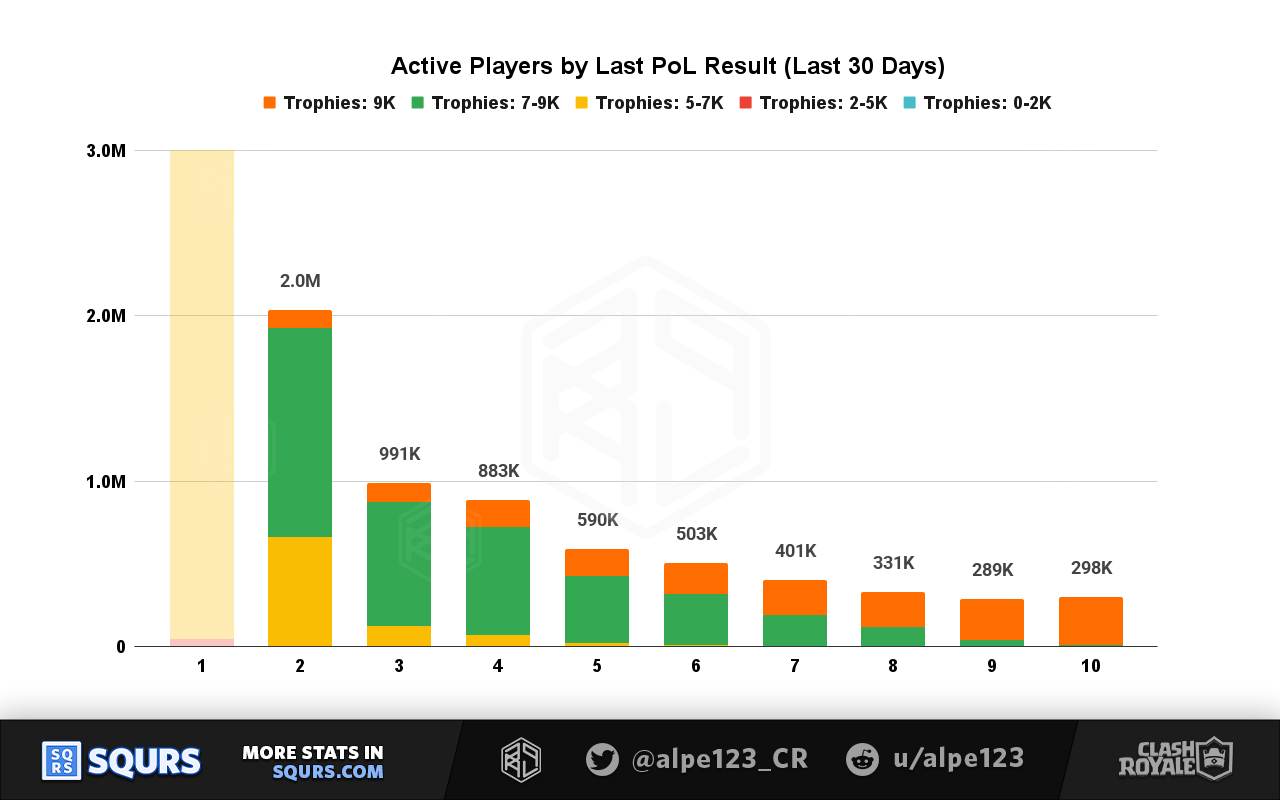
Last PoL Season
The last season is the one that finished on April 7th (2025-04-07).
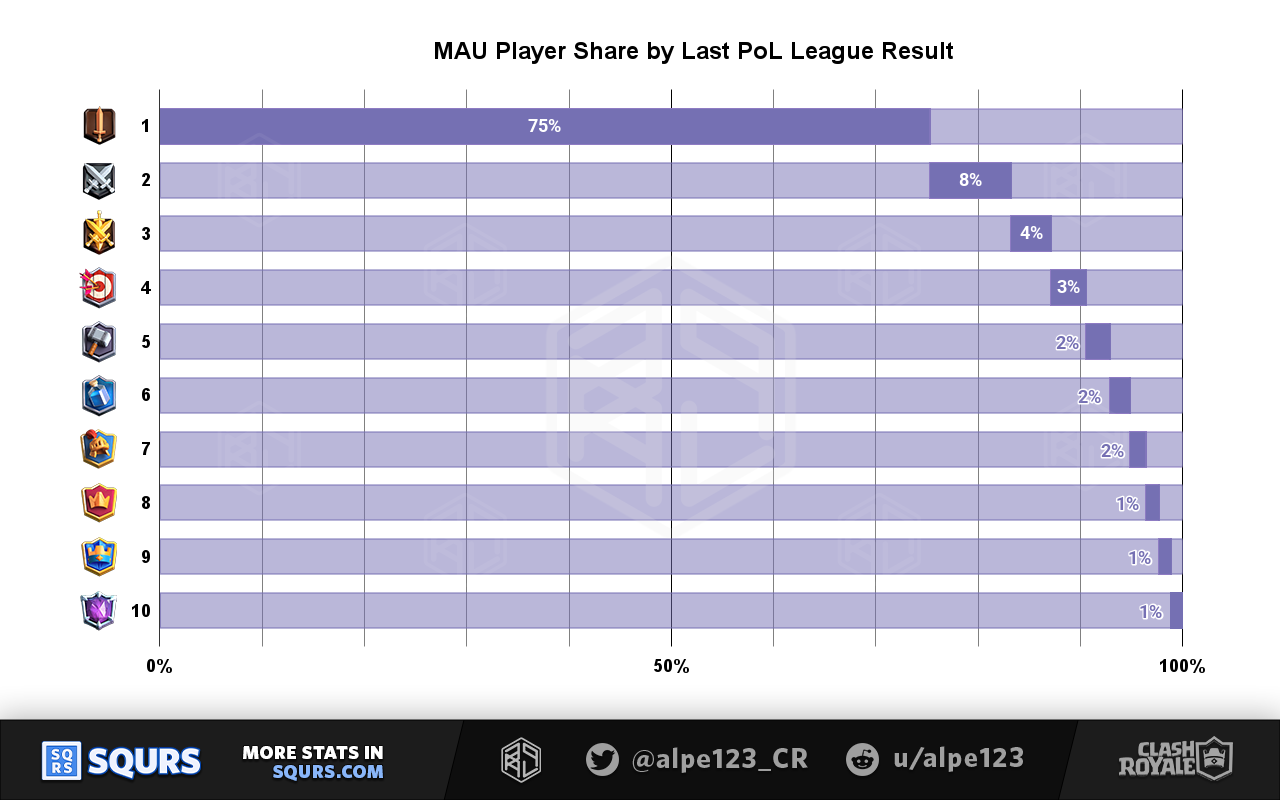
Key Insights
From the monthly active players with more than 5K trophies, more than 75% didn't play or complete League 1 of Path of Legends during last season. Less than 10% completed League 4.
These results show that PoL isn't a relevant mode for the majority of the active playerbase. This places it as a mix between endgame content and a competitive ranked mode, very distinct to Trophy Road.
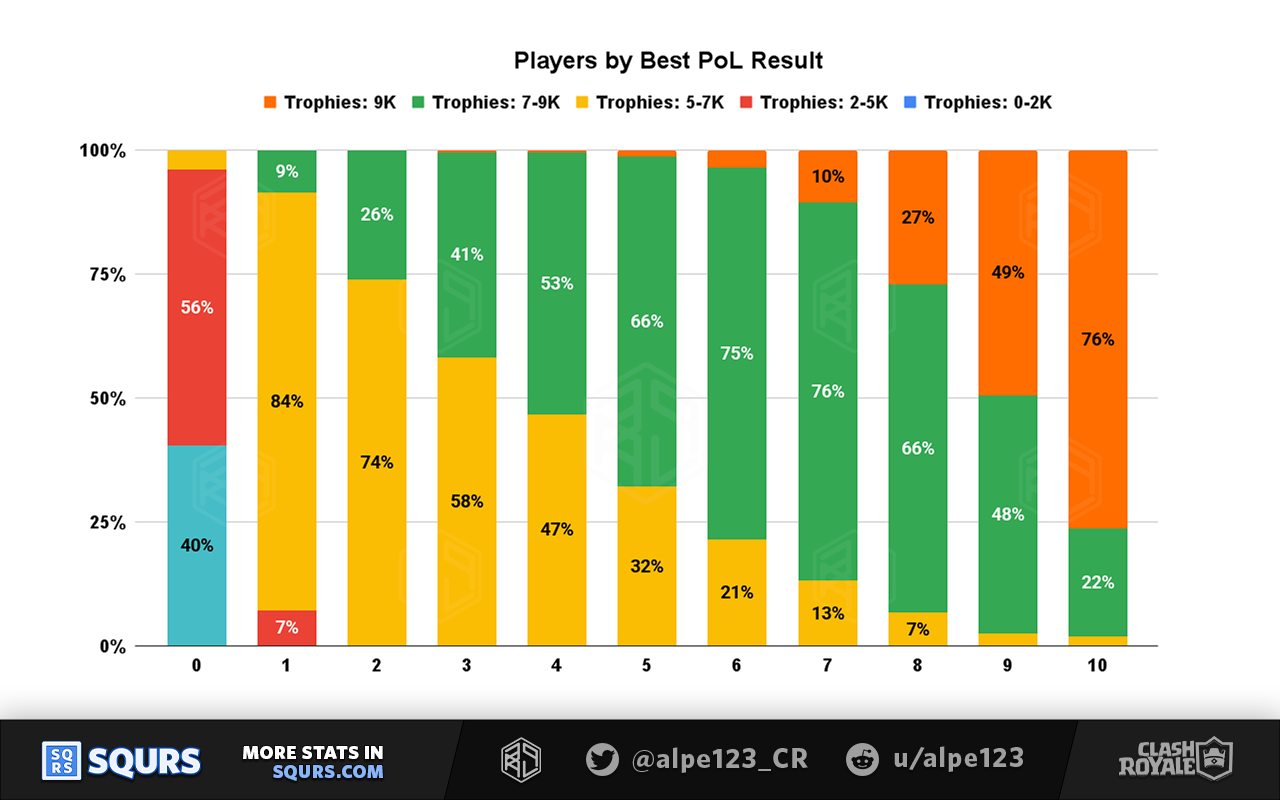
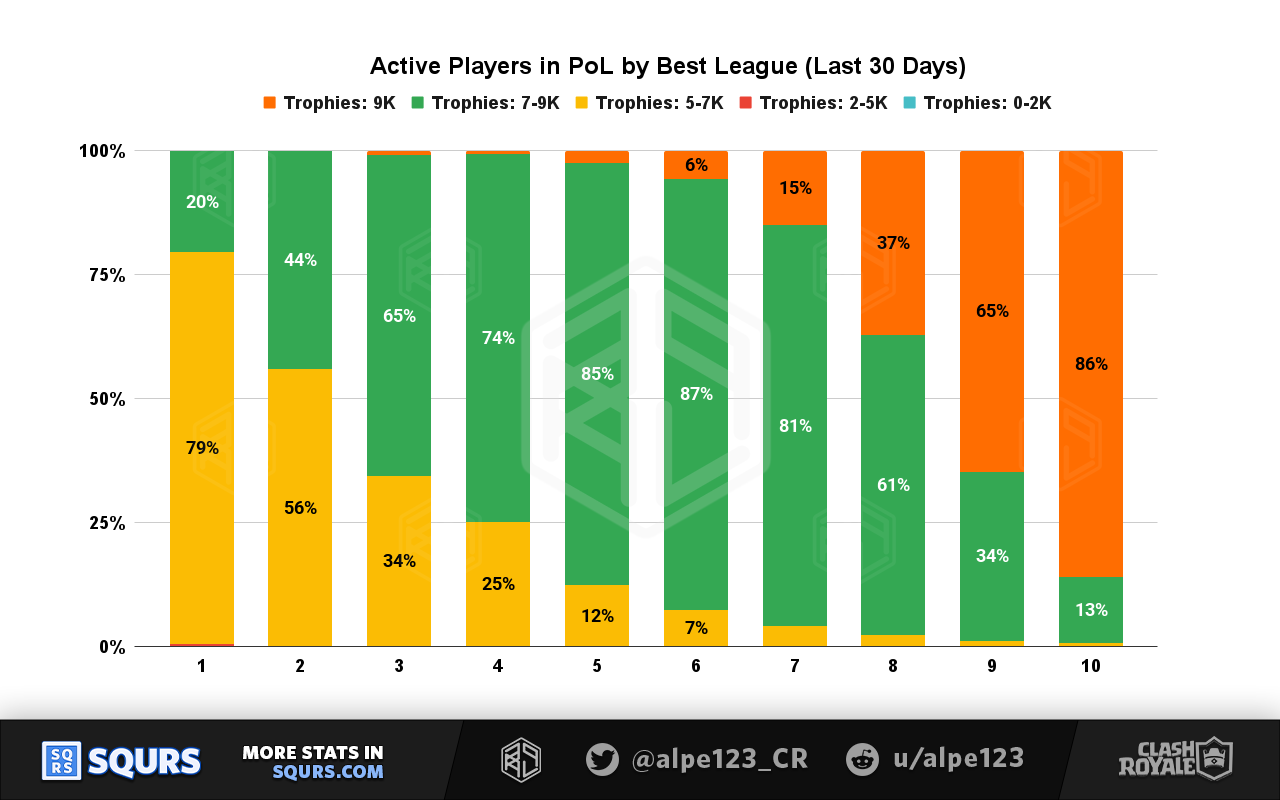
If we break down the league results by the trophies of each player, we can see that players mainly give attention to this mode after reaching 7K trophies.
Trophy segments share chart
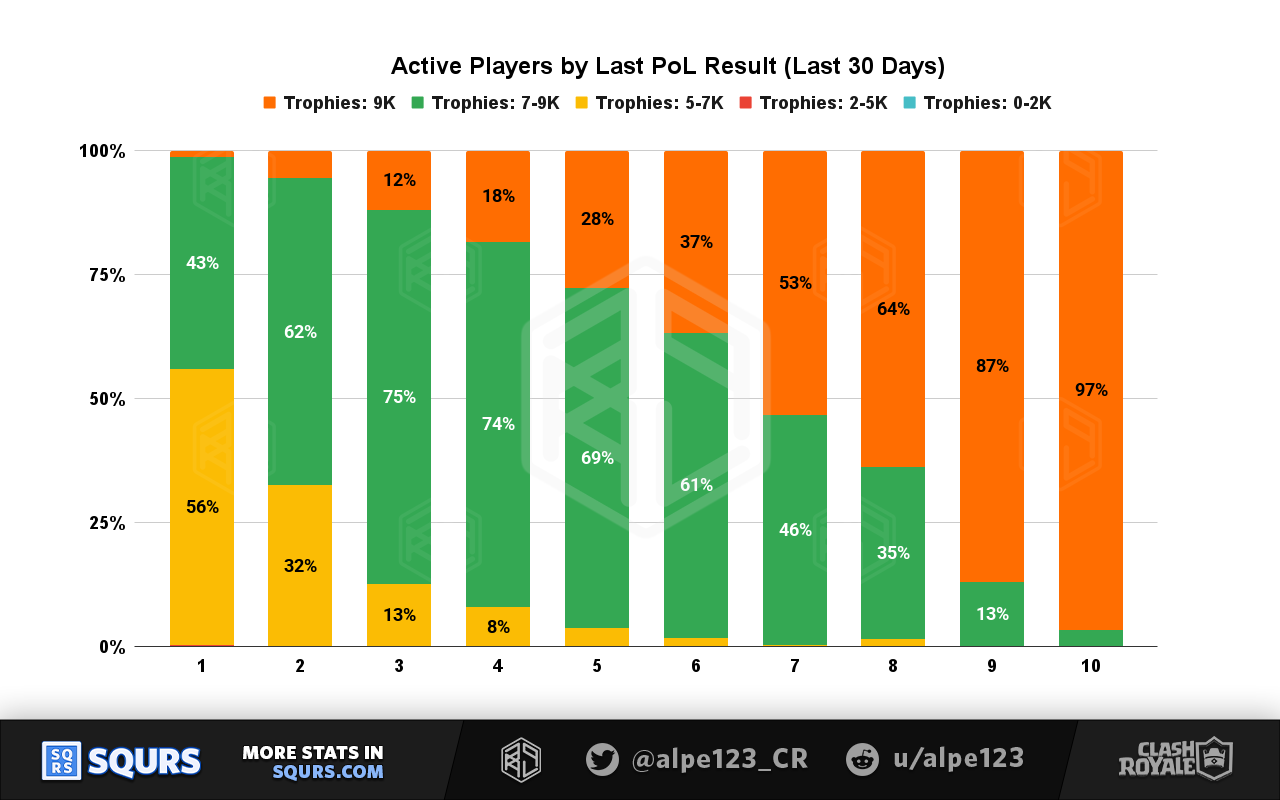
Players are more likely to engage with PoL as they climb up in Trophy Road:
- 5-6K tophies: 4% of players completed League 1
- 6-7K tophies: 10% of players completed League 1
- 7-6K tophies: 24% of players completed League 1
- 8-9K tophies: 49% of players completed League 1
- 9K tophies: 88% of players completed League 1
There's probably a mix of factors contributing to this correlation:
- Better card levels make PoL more approachable
- Getting stuck in Trophy Road pushes players to find alternative modes
- Players discover the useful rewards available from this mode
Player Levels
Player levels received a significant update in June 2023. This update extended levels from 50 up to 70, but the most significant change was arguably the introduction of Level 15 cards.
Card upgrades to Level 15 provide so much XP compared to other sources that player levels have essentially become a measure of account progression. The weight of donations and other tasks, while relevant in the past, are negligible nowadays.
Share of MAU chart
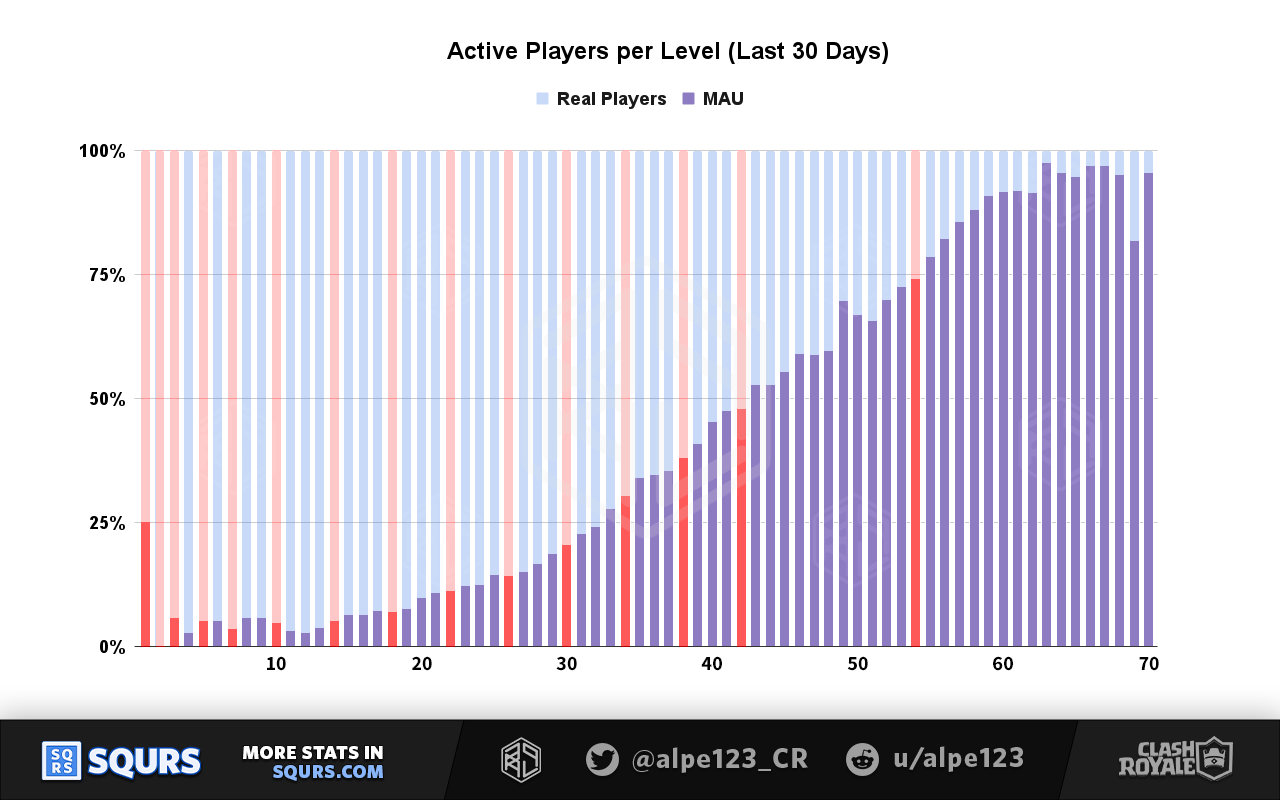
Players who have invested a lot of time levelling up their accounts are very unlikely to stop playing, becoming permanent regular players.
Evolutions & Monetisation
Card evolutions were added to the game in 2023, creating a new layer of horizontal progression.
Evolutions can be unlocked for free, but new releases are sold through in-app purchases (IAPs). There are 2 main types:
- Pass Royale Evolution, with Diamond Pass Royale ($12 USD)
- Evolution and cosmetic, separate IAP ($10 USD)
These purchases guarantee the unlock upon release, removing the hurdle of unlocking this content through other means.
As alternatives to these purchases, players can unlock evolution shards from:
- Wild Shards (a wild card for evolutions)
- Level Up chests
- Special Events (in a future seasons)
- Cheaper shop offers (in a future seasons)
- 5-star Lucky Drops
These options require players to be quite active, and make it harder to obtain the most recent evolution releases.
Evolution Unlocks per Player
At the time of writing, 31 evolutions have been released.
Our results show that around 50K players have unlocked all of them, but we can't say this confidently due to the sample size of our snapshot. Even if this result isn't precise, we can read it as an order of magnitude approximation.
Most of the players are far away from unlocking these many evolutions:
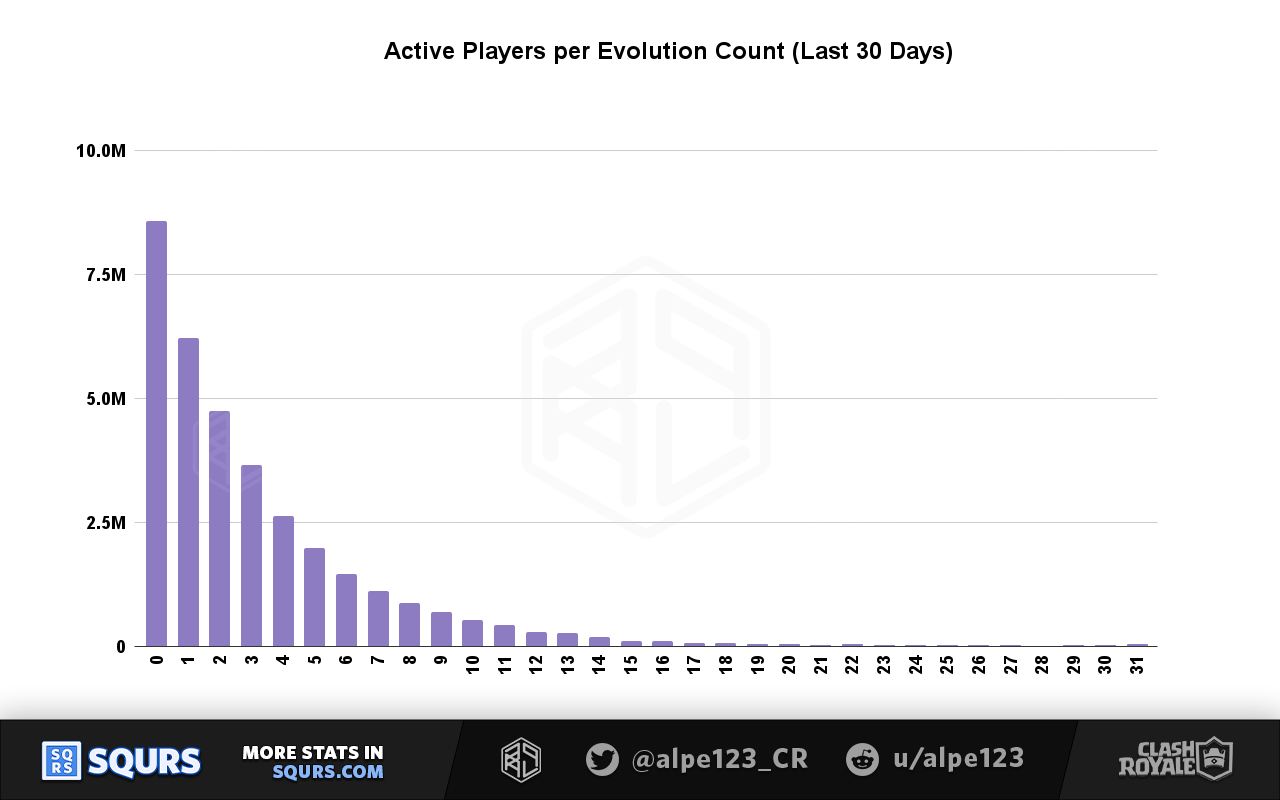
As a summary for this chart:
- Players with 1 or more evolutions: 26M (75% of MAU)
- Players with 2 or more evolutions: 20M (57% of MAU)
- Players with 5 or more evolutions: 9M (25% of MAU)
- Players with 10 or more evolutions: 2M (7% of MAU)
- Players with 20 or more evolutions: 330K (1% of MAU)
- Players with 30 or more evolutions: 80K (0.2% of MAU)
Evolution Unlock Share
During their release, most new evolutions are unlocked by 1-2 million players. Over time, this amount increases as players earn and buy shards.
Some evolutions have been unlocked by many more players, usually due to special events. For example, Valkyrie was given away to all players in celebration of Clash Royale's 9th birthday.
This chart shows all the evolutions, in chronological order based on release date.
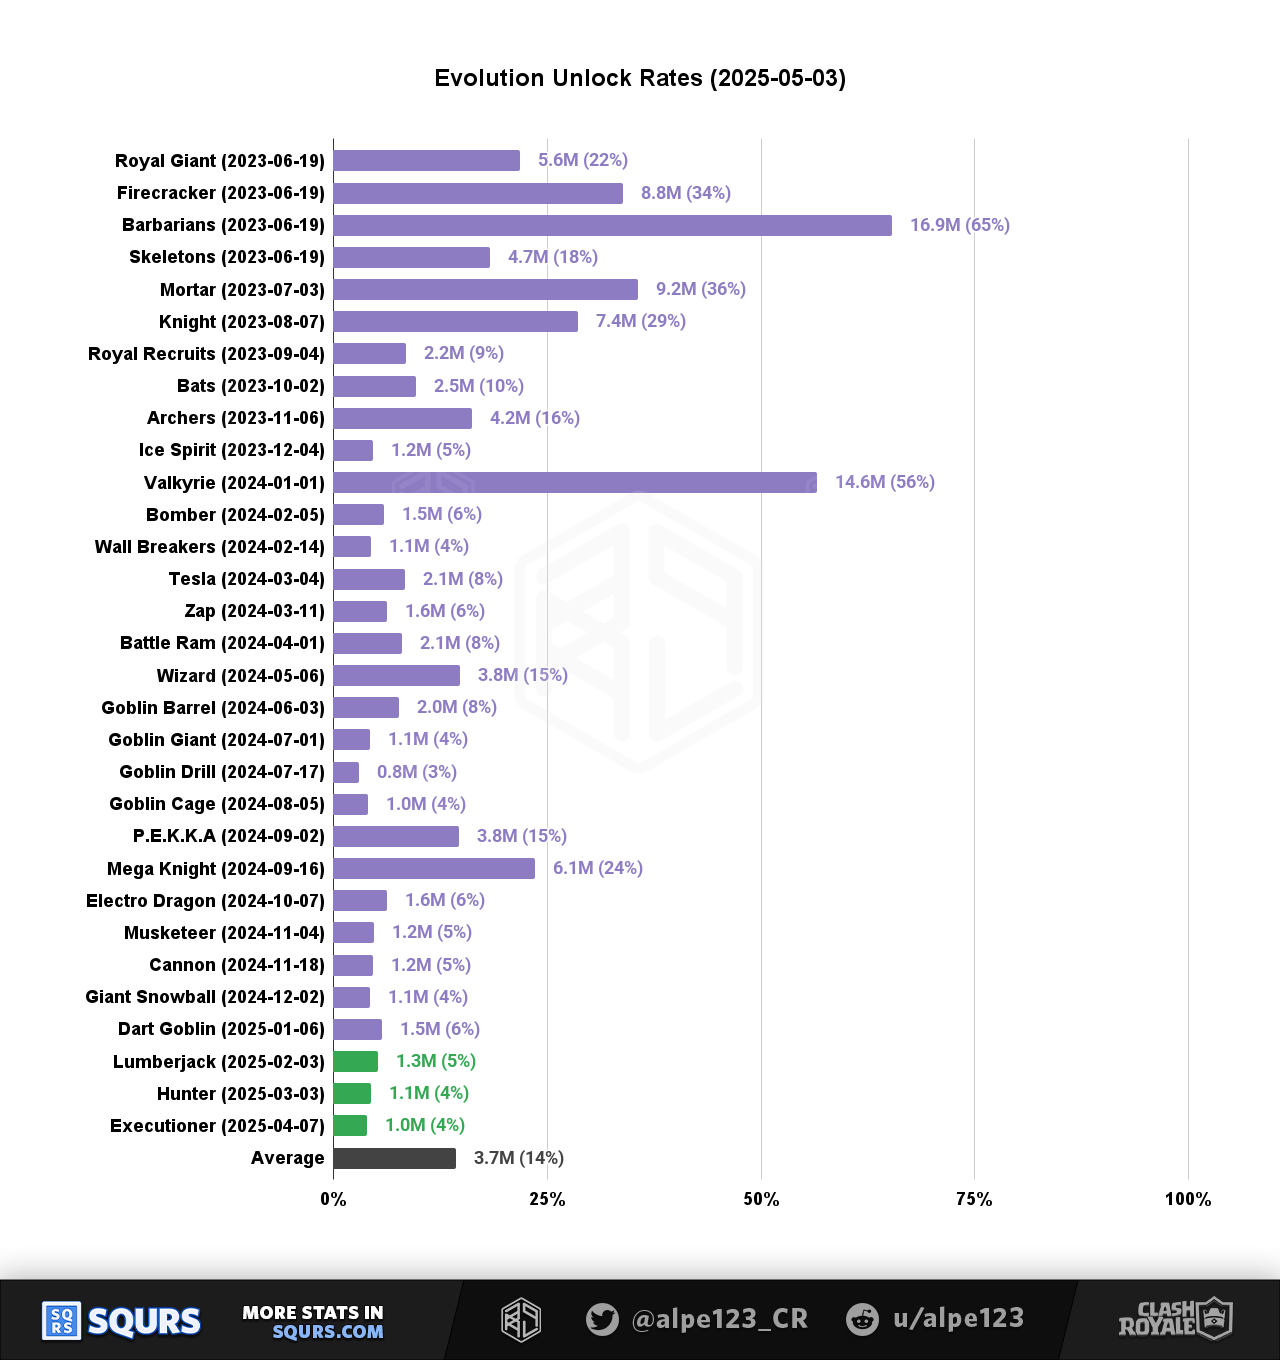
Different Fetch Time
Unlike the other stats of this snapshot, the data for this chart was fetched on 2025-05-03.
This is 2 days before the end of the season, which should provide much better data for the purchase rate of Evolved Executioner.
Below you can see what the chart looked like at the time of the main snapshot, on 2025-04-19 (2 weeks earlier). Since them, the amount of players with this evolution increased from 0.6M to 1.0M.
Other values change slightly as well, and that is mainly due to the moving window for what we consider a Monthly Active User. For example:
- Valkyrie is reduced from 15.2M to 14.6M. This evolution was given away in mid-March to everyone, and some players stopped playing shortly afterwards.
- Other evolutions increase at a 0-10% rate, which is likely related to basic progression from Wild Shards.
Chart of 2025-04-19
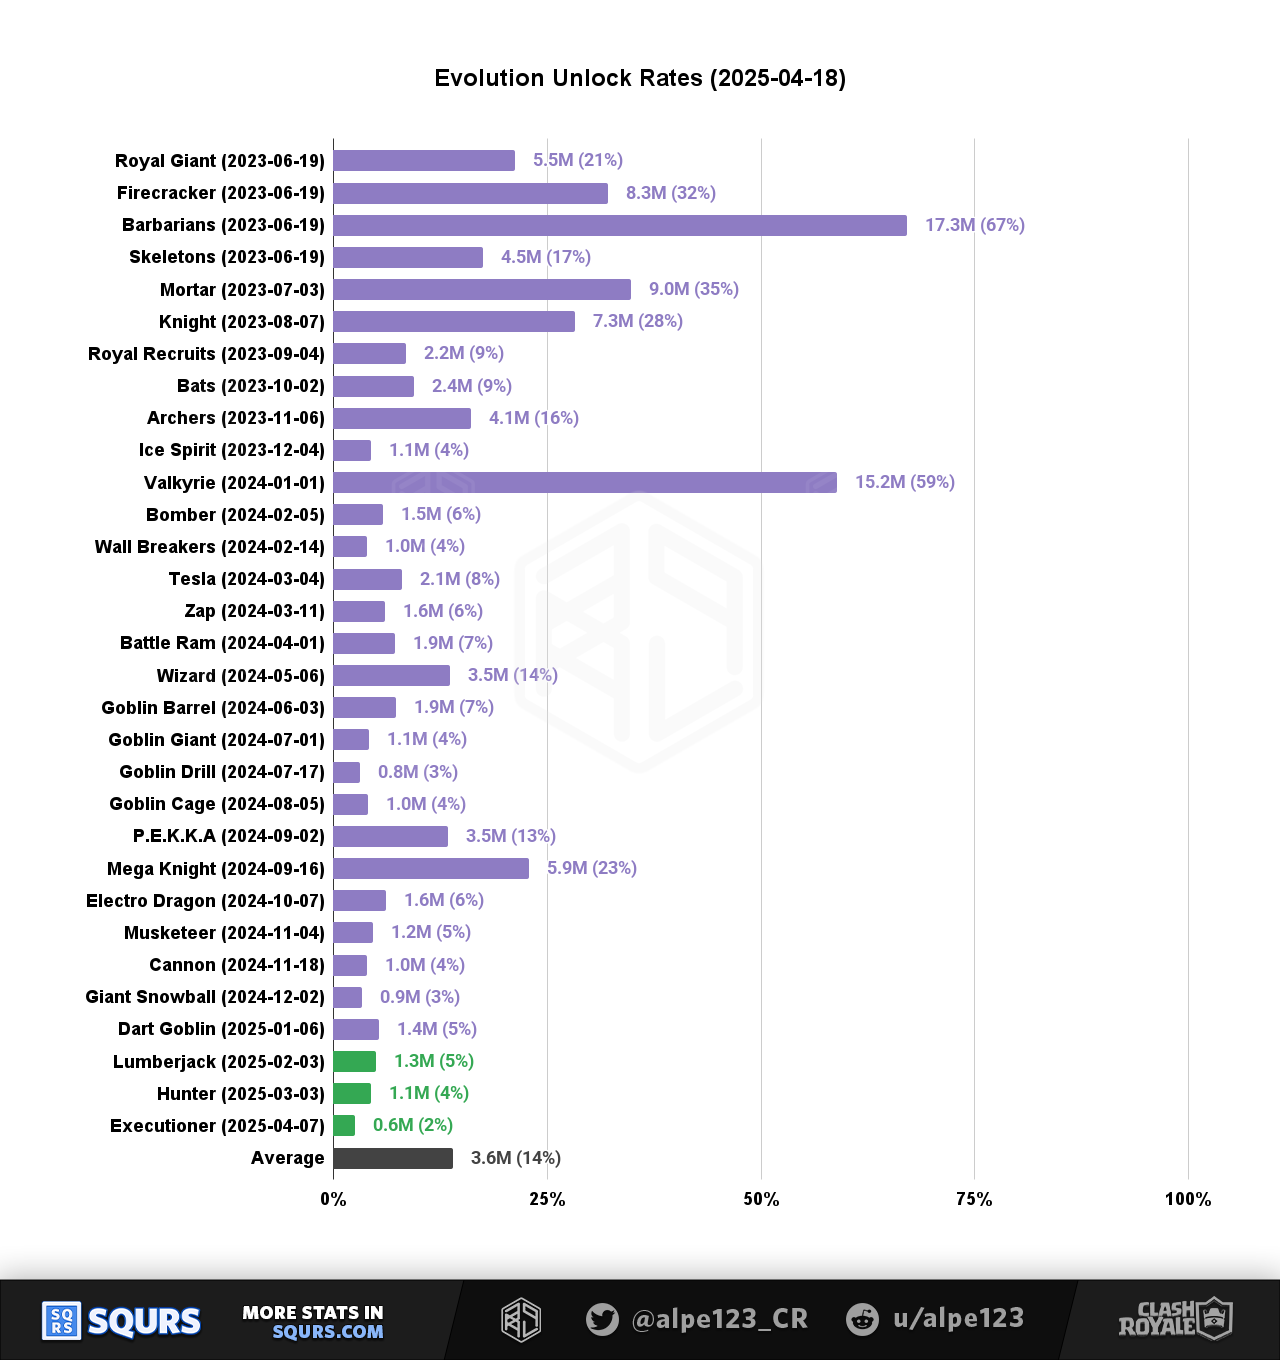
Chart sorted by Unlock Rate
This is the same chart of 2025-05-03, but with evolutions sorted by player count.
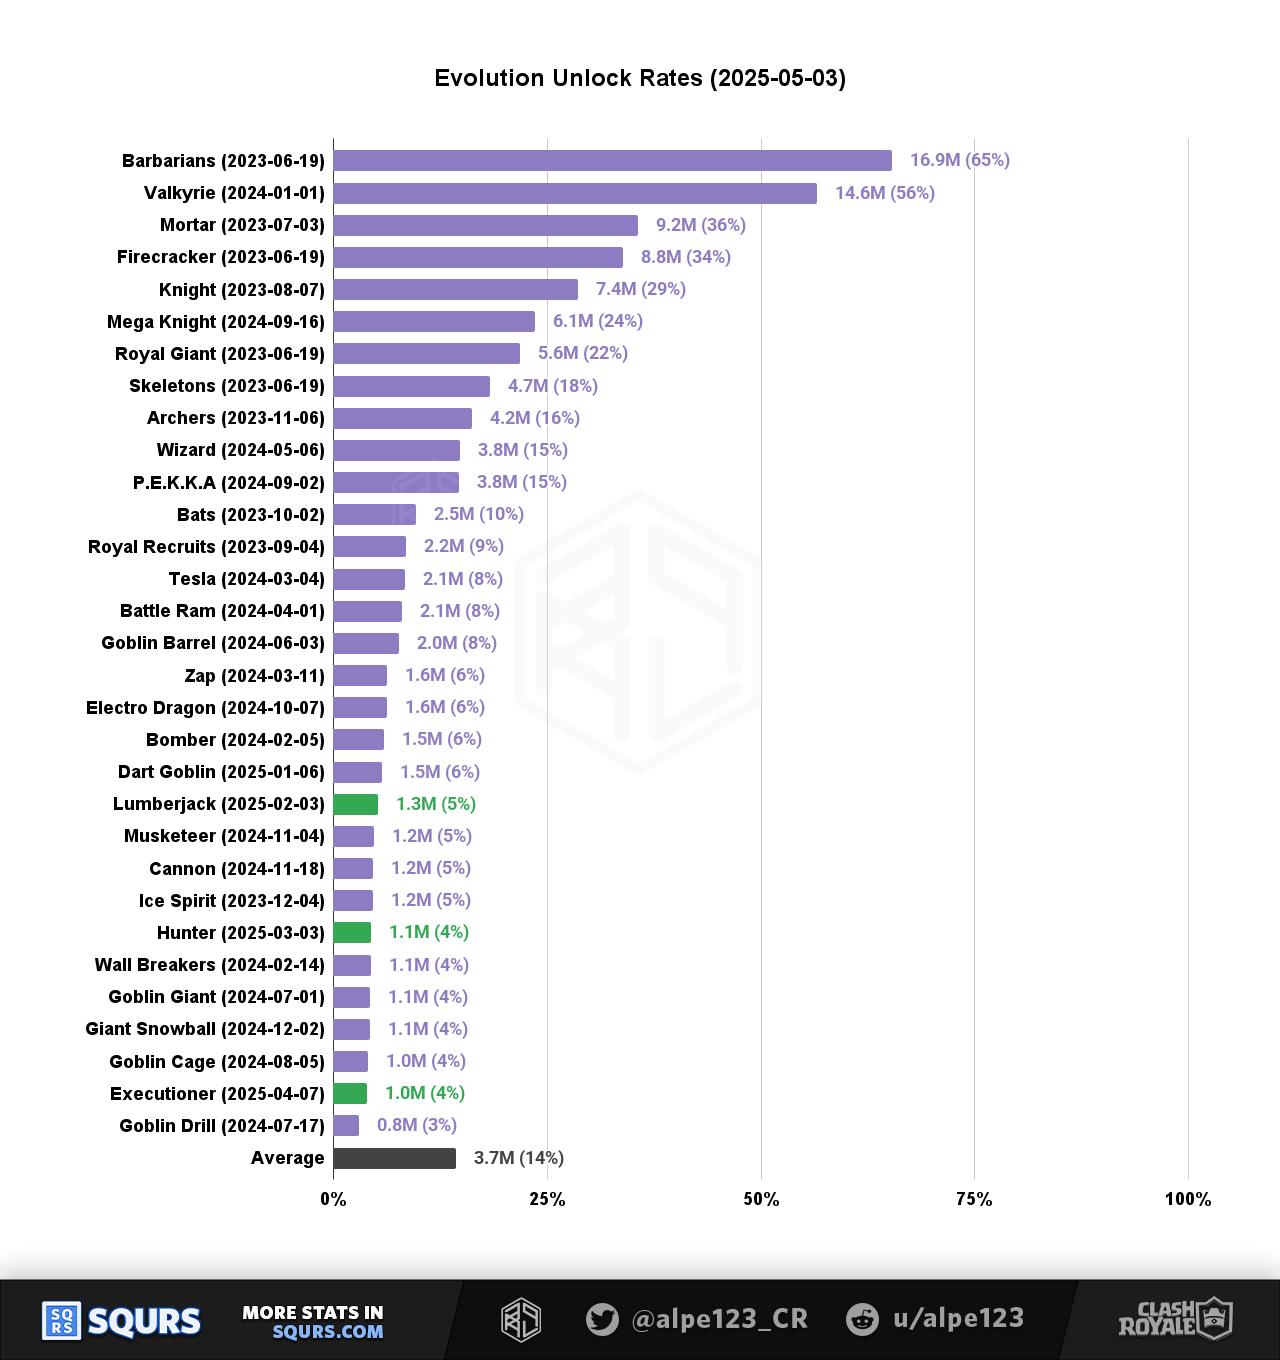
Some evolutions like Barbarians, Valkyrie and Mega Knight stand out due to these special events that gave them for free.
In these charts, unlock percentages are with regard to the total amount of MAUs with at least 1 evolution.
Pass Royale Buyers
We can use evolution unlocks as a proxy for Diamond Pass Royale purchases. This estimation becomes less and less reliable as time goes by and players unlock evolutions through the other means we just mentioned, but should be fairly accurate for those evolutions that were released in the last 2 months.
Given that this snapshot was taken in April, we can look at:
- Lumberjack (February)
- Hunter (March)
- Executioner (this season)
These 3 evolutions oscillate between 1.1 and 1.3 million players.
If we translate this into purchases, and add a ~30% purchase fee, the total revenue is around $10M USD per month. This is only the value attributed to Pass Royale, and doesn't include purchases for other products inside the game.
For better or for worse, these stats don't differentiate between purchases done through app stores or though the official web store. This means that even if Supercell is able to move customers to other payment methods, this methodology will remain reliable.
Regular Pass Buyers
We can also use the last 3 evolutions to find out the amount of regular Pass Royale buyers.
Regular buyers are expected to have all 3 evolutions, allowing us to separate players who simply found a certain evolution more appealing than usual.
Key Insights
Around 250K players have unlocked the last 3 evolutions. This is a good proxy metric for regular Pass Royale buyers, which costs $12 USD.
Buyer Stats
What kind of player is buying Pass Royale regularly?
Buyers by Player Progress
Path of Legends Best Season is useful for this. It does a good job at separating players, from casual to hardcore.
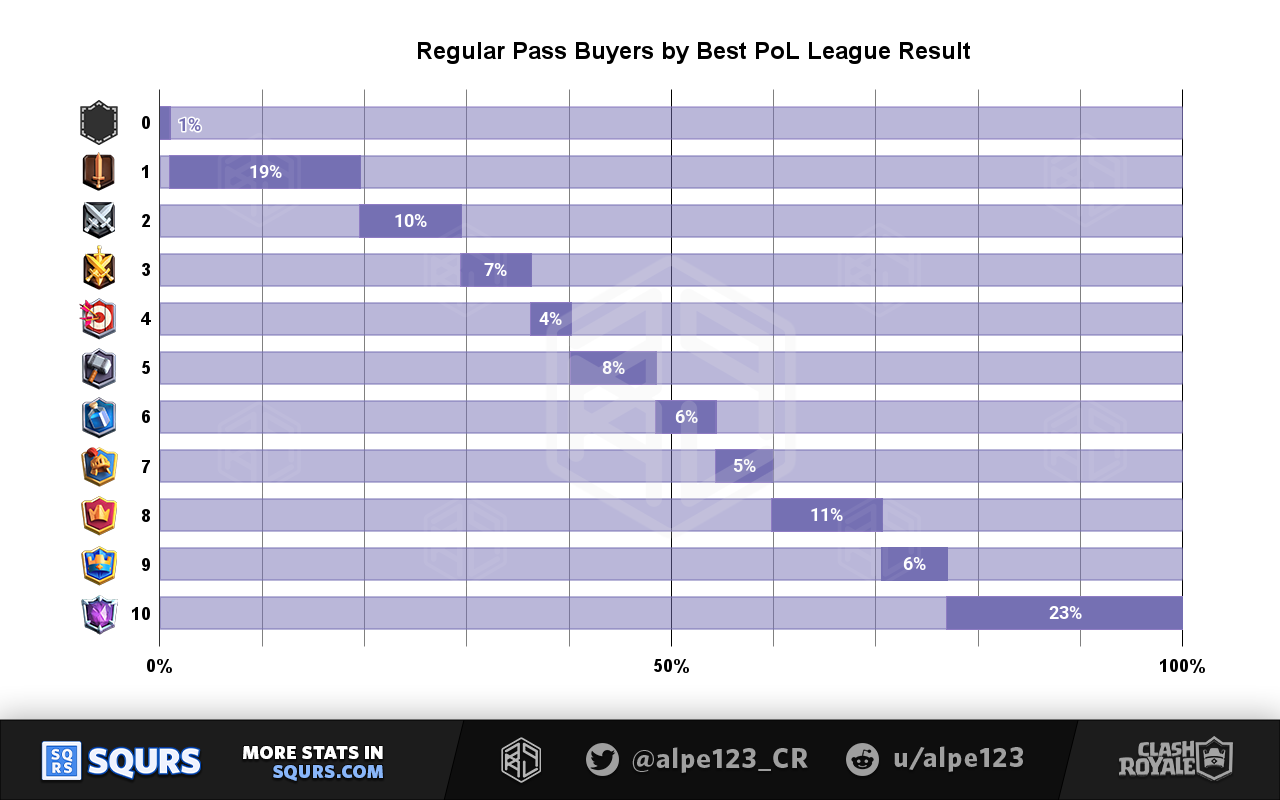
The results show a fairly even distribution. There are about as many buyers who reached Ultimate Champion (hardcore) as buyers who never really played PoL (casuals & beginners).
These shares are strongly correlated with Trophy Road scores:
- The 60% of buyers under League 8 are overwhelmingly under 9K trophies
- The 40% of buyers above League 7 have completed Trophy Road and sit at 9K trophies
Buyers by Account Age
Another interesting segmentation is based on account age:
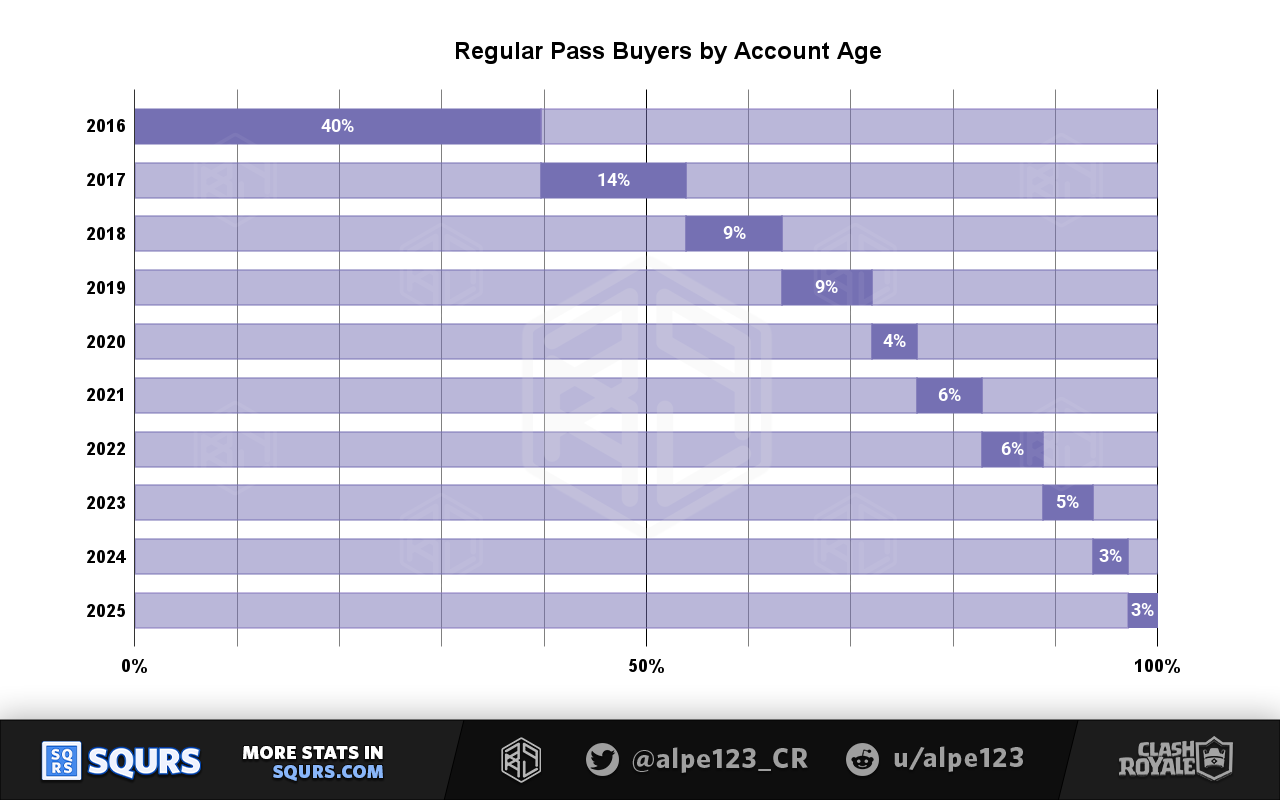
Just by counting players that joined in 2016 and 2017 we have more than half of the regular buyers.
How different is this share of buyers when compared to MAU shares?
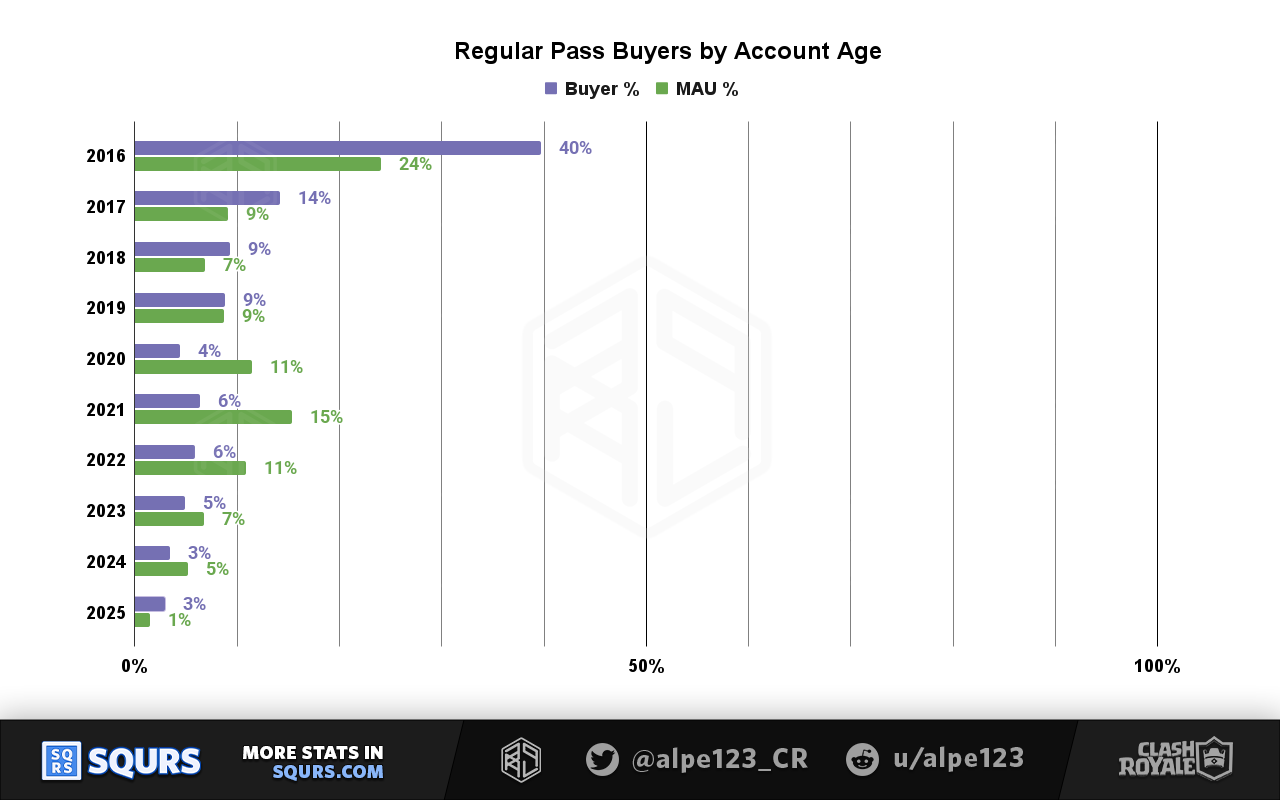
Players acquired between 2020 and 2024 seem much less likely to be regular buyers.
Other stats, feedback and contact
There are many other stats that could be interesting to look at, but we decided not to because this was already VERY long. Some of these are Emotes, Battle Banners, Challenges, Special Seasons, Card Collections, Clan Wars, Global Tournament...
If you are interested in any of these, or something else entirely, let us know and we might write a Part 2 or a brief sequel.
As always, if you have any questions or requests for future content, you can:
- Join our Discord Server
- Message or mention mention us on Twitter, @Alpe123_CR