
Clash Royale Playerbase Snapshot (2025 Q3)

Authors:
Media Guidelines
Are you a content creator covering this blog? That's great! But please, read and follow our media guidelines when using our content.
Last updated: 2025-09-02
Page change log:
- Created: 2025-09-02
Page contents:
Key Insights
This blog contains several stats and comments that we consider especially relevant, which we labelled as Key Insights. These buttons allow you to navigate through them and get a quick recap without missing the highlights.
About 4 months ago, we published the first Playerbase Snapshot for Clash Royale; an advanced deep dive into the state of the game and its players.
Little did we know that this analysis was released just before an impressive resurgence of the game, which has quickly become trendy and quite profitable. This puts us at a great position to break down the changes of the last few months and shed some light into this interesting evolution.
This blog isn't meant to be a simple update of the Q2 Playerbase Snapshot. In that post we looked in detail at many historical stats and distributions, which would be redundant to cover again. Instead, we'll focus on new stats and relevant developments. If you are interested in the previous snapshot, you can find it here:
About this snapshot
These caveats haven't changed since the last snapshot, as our tools and methods are mostly the same.
Our research has limitations and we don't have access to all the stats of the game, but you can expect to find some details about player acquisition, long-term retention, daily active users, Pass Royale revenue and many other stats.
Unless we indicate otherwise, all the data presented here was collected and processed by us. If you want to know more about our methodology, these are a few more details and context for our stats:
Data Collection Period
The main data presented in this blog was collected between 2025-08-27 and 2025-08-29, unless indicated otherwise. The reference data from the Q2 snapshot was collected between 2025-04-17 and 2025-04-20, so there's a gap of about 4 months between samples.
Our Sources
All the data presented here is publicly available, mainly though the official Clash Royale API.
From this API we can obtain some basic stats for any users. In this case, the most relevant ones are:
- a log of recent battles
- values for meta progression
- basic metrics, such as amount of battles played and player level
Data Reliability
All the data used for the following stats was obtained through randomised samples, with a precision of around 1 sample for 1,000 accounts.
This allows us to look at macro-trends for the game, but can be limited when looking at events in which the expected amount of players is below 100K. Under that, results of our samples are less likely to be good representations of reality.
The priority of this randomisation was to match account density over time. This means that for any given day, we'd sample an equal amount of accounts.
Although technically we could increase the size of these samples, providing much better accuracy, we'd be sacrificing instantaneity to achieve that. For example, the snapshot could take several days to be taken, instead of just 1 day.
Taking a snapshot over such a long period of time creates other issues, as player behaviour may change significantly from the start to the end of it.
In summary, we chose this sample rate because we think it's a good compromise between size and speed.
Our Limitations
Given that we are using public data, there are some kinds of stats that we don't have access to. For example:
- No direct information for in-game purchases
- No logs of player actions
- No information about users, such as location, device, age or other details
Cleaning Data
Due to how accounts are created in Clash Royale, we need to apply certain filters to help us remove noise.
In short, whenever the Clash Royale app is installed and initiated, it creates a new account that gets added to the playerbase. The prompts for players to log in and resume progress happen afterwards, meaning that a significant amount of accounts are constantly being created and never get to be used.
For this analysis, we aim to get past all these dummy accounts and bots that Supercell uses to facilitate matchmaking. To do so, our main filter is a minimum amount of battles.
Real Accounts:
We consider real players those that have more than 100 battles played, which is equivalent to 5 hours of gameplay.
Bans and Removed Accounts
One of the main constraints of our data collection is that some accounts have been removed from the public API, so for us it will seem as if these players never existed.
Permanently banned accounts fall into this category. Although it's hard to estimate their relevance, our guess is that it is low. Causes for these bans are usually:
- Game exploits
- Repeated disruptive behaviour
- Account sharing
This issues may seem common among competitive players, but less so for the broad playerbase.
In contrast, the server split that happened for China in 2022-03-16 is probably quite relevant. We don't have good stats for these either, but the share of the playerbase may have been around 10%.
Most of these accounts are still active in the local servers, but the international API doesn't have access to them.
Recent Account Age Estimates
Accounts with less than 1 year of age do not provide a specific age through the public API. We use alternative methods to approximate their age, with errors that should be in the order of days at most.
The Clash Royale boom
Before writing this blog, we had already seen multiple references to the resurgence of Clash Royale. Content creation has performed unusually well in recent months, and 3rd party revenue reports point towards a significant increase. This section briefly looks into these observations, and may give useful context for the actual results.
If we look at content, performance seems to be improving, but it's still far away from its heyday. YouTube is arguably the main content platform for the game, followed by TikTok and then Twitch.
YouTube stats
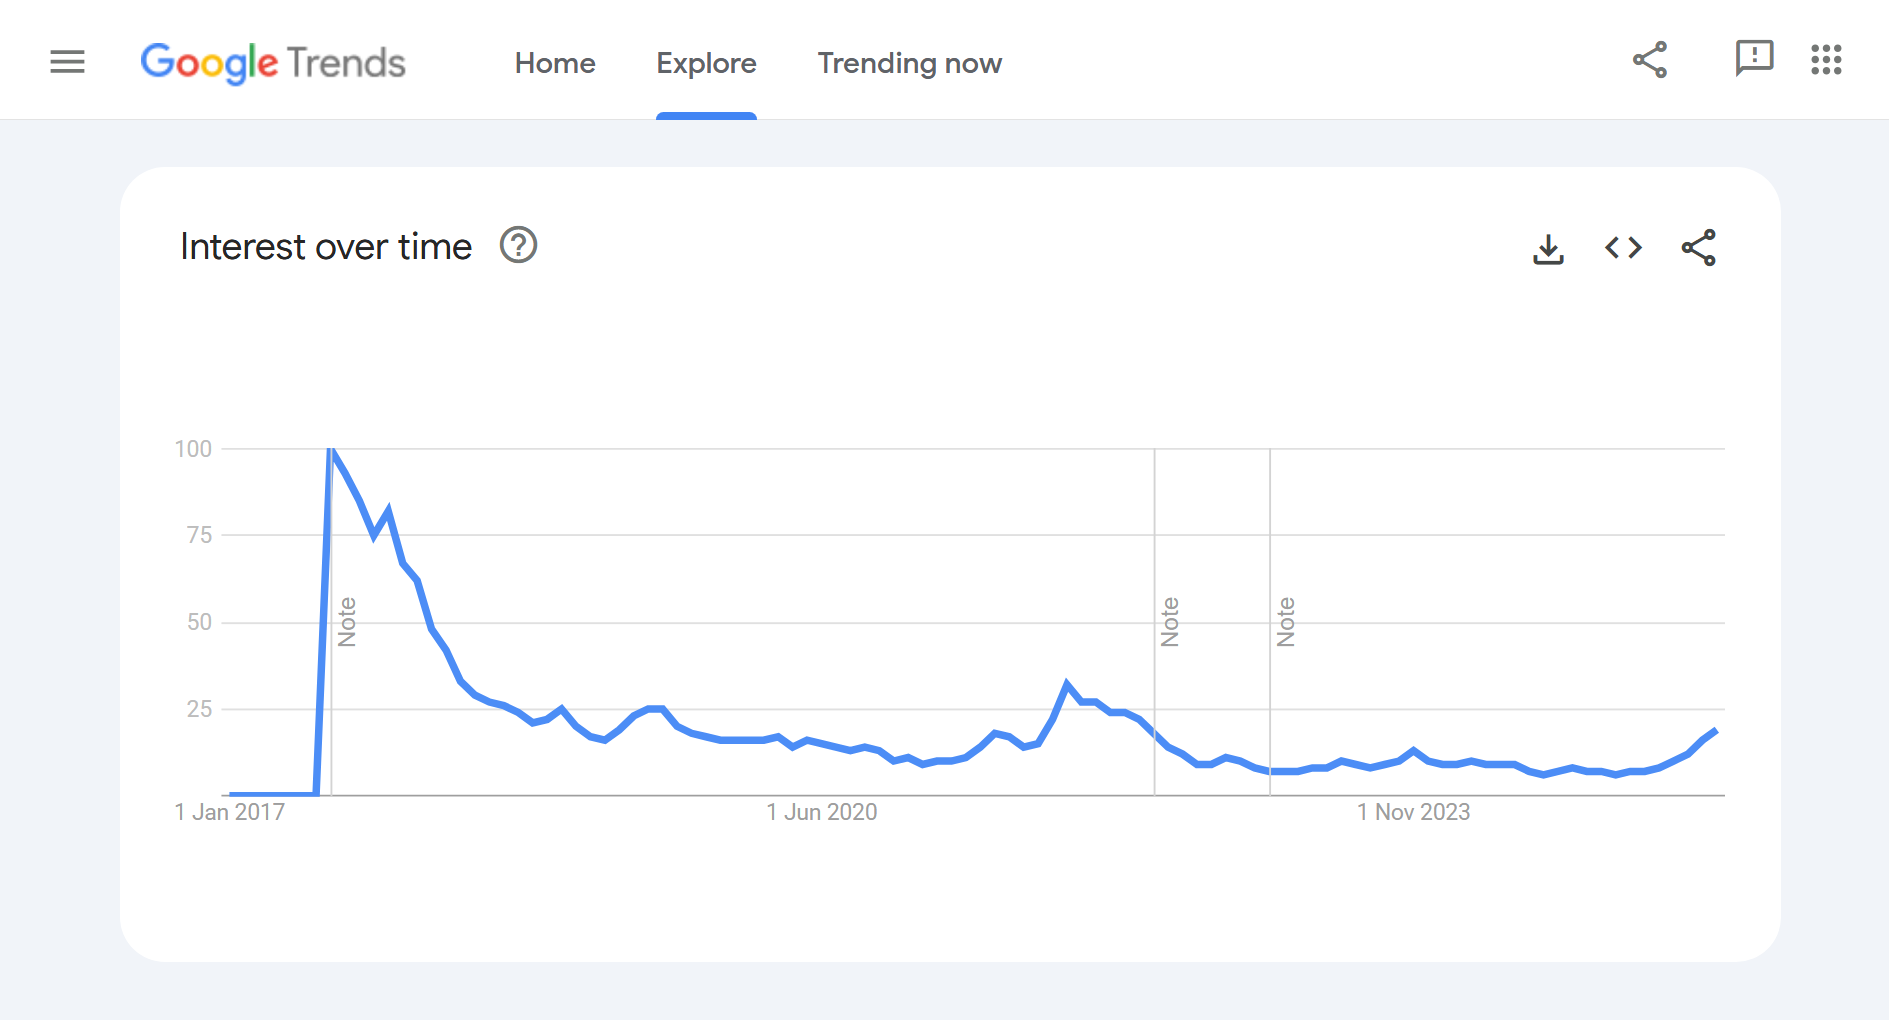
Stats from Google Trends.
Although we don't have audience stats for the "Clash Royale" category as a whole, here are the view stats of the most prominent youtubers dedicated exclusively to the game:
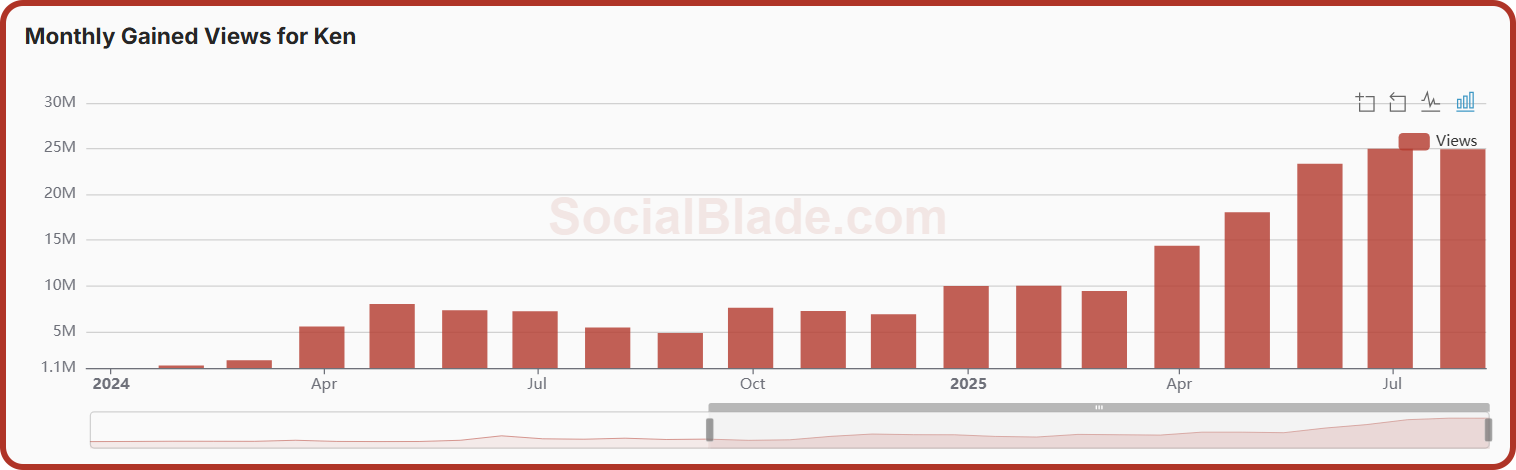
Stats of Ken from Social Blade.
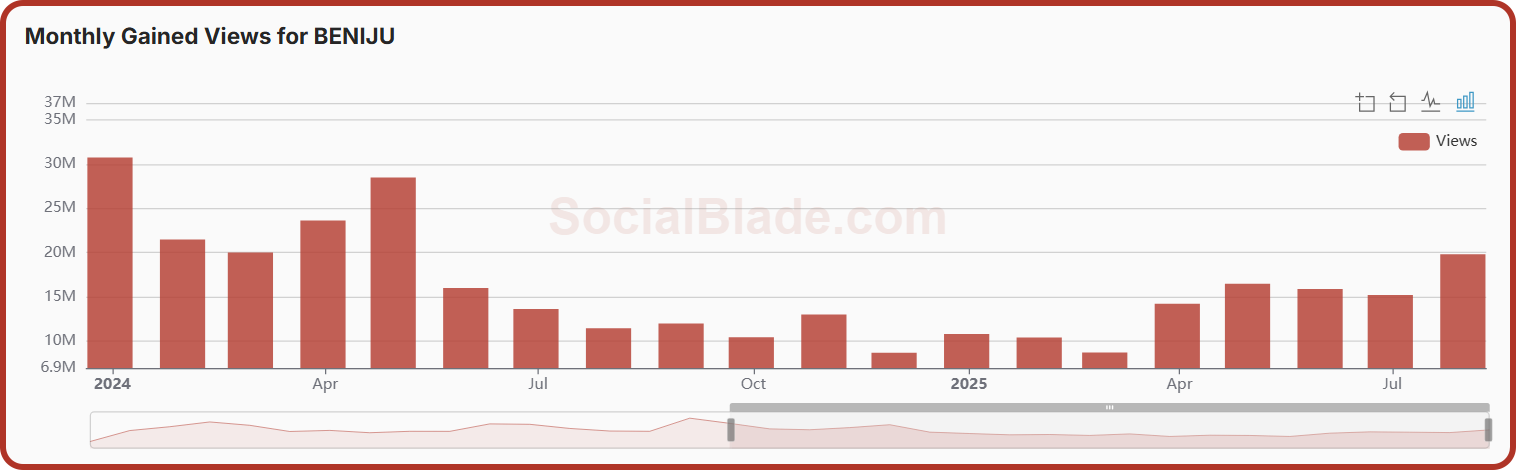
Stats of Beniju from Social Blade.
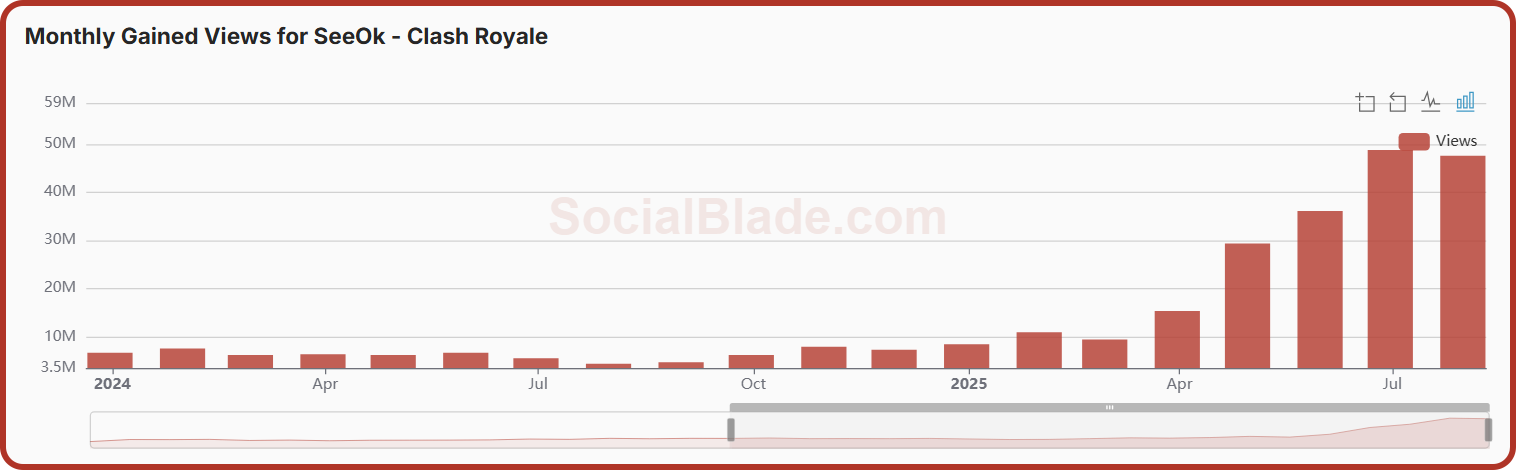
Stats of SeeOk from Social Blade.
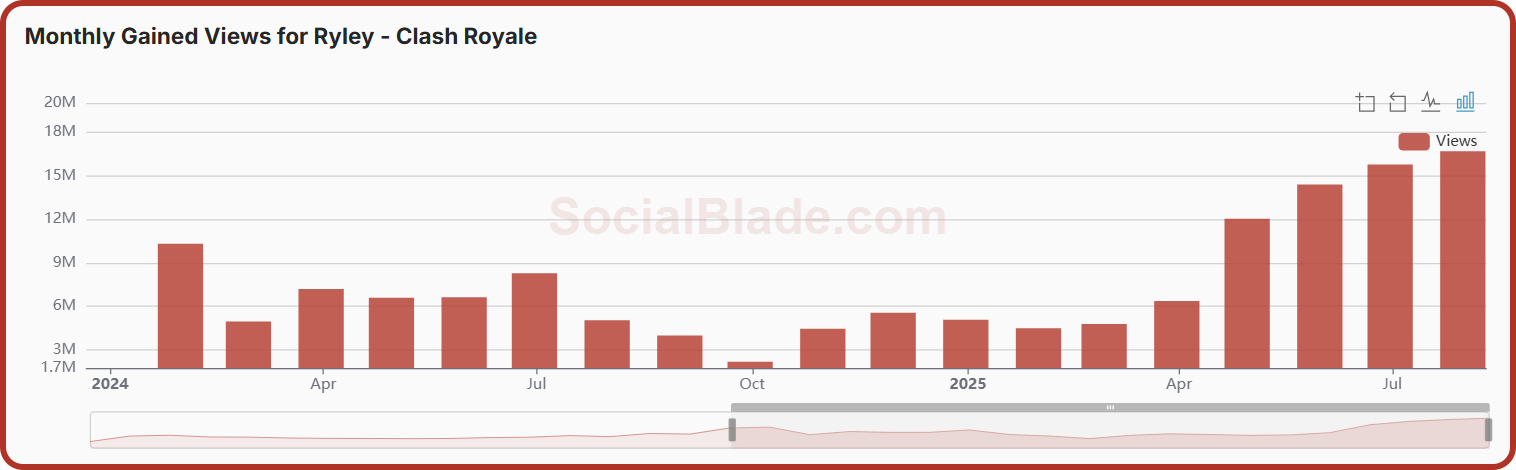
Stats of Ryley from Social Blade.
These examples should be seen as a biased sample. Channels that have declined or been abandoned would be less likely to be listed among those with the most current views.
These charts show a positive trend, but as we saw in Q2: New Players VS Google Trends, the way this translates to game performance is unclear. More interest is certainly not equivalent to user acquisition.
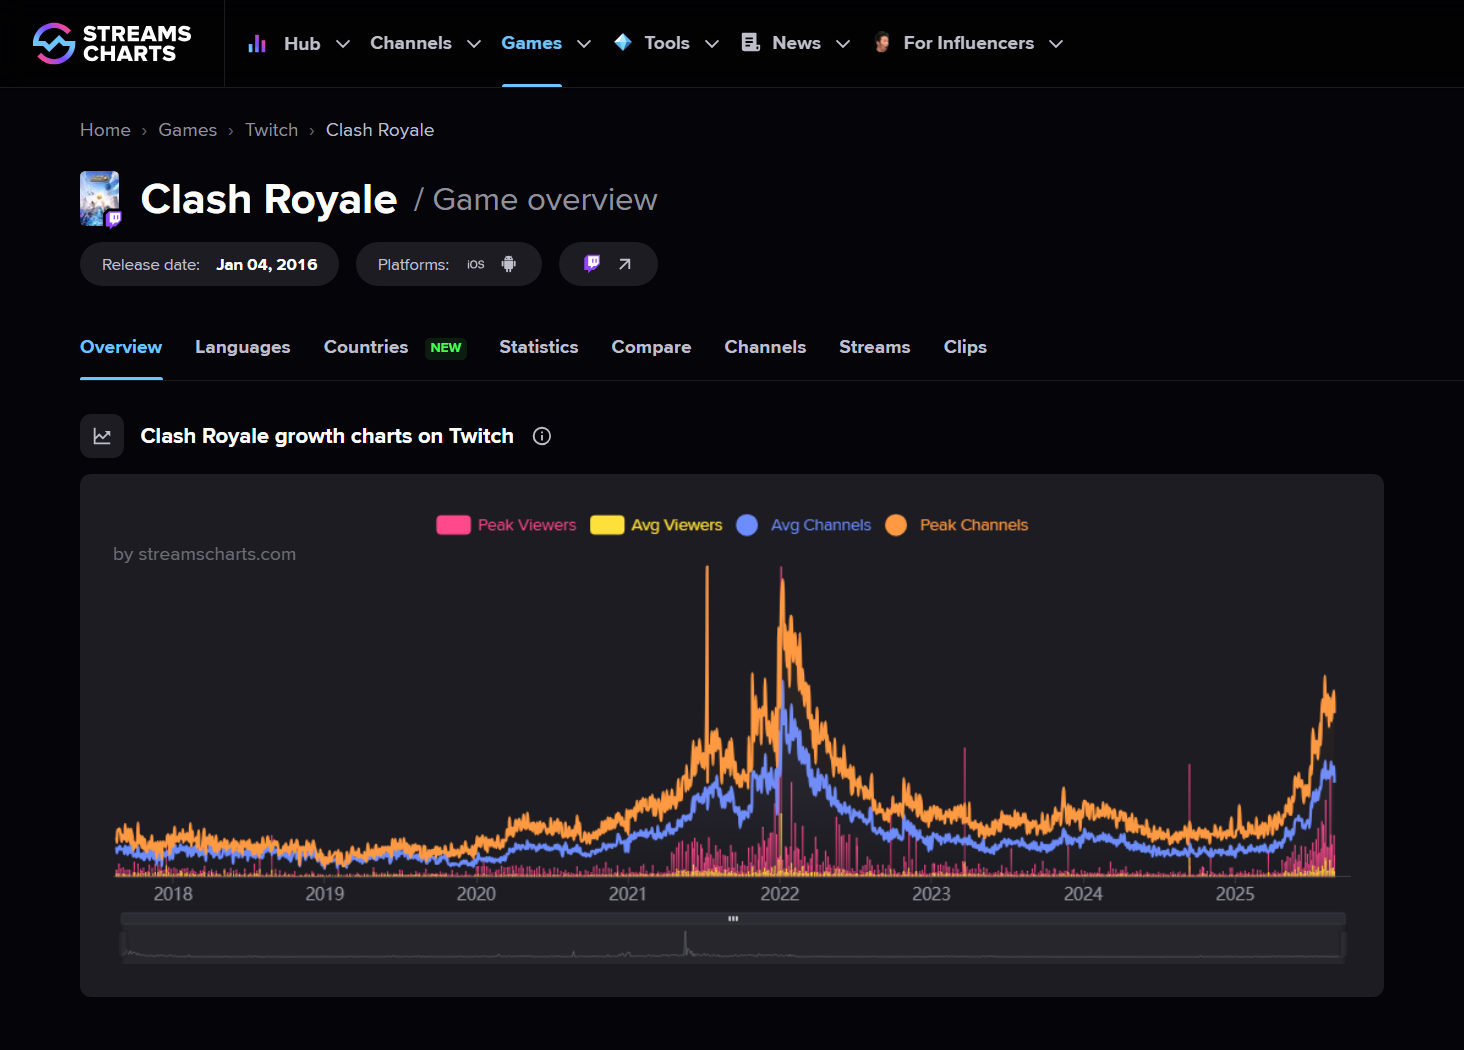
Some members of the community have pointed towards personalities like Jynxzi, a Twitch streamer with 8 million followers, as the main reason for the popularity boost. Was he a catalyst? A wave rider? A coincidence? It seems hard to tell how relevant his role has been. His first Clash Royale stream happened on April 24th, coinciding with the start of the content trend, but other stats had already reached an inflection point by then.
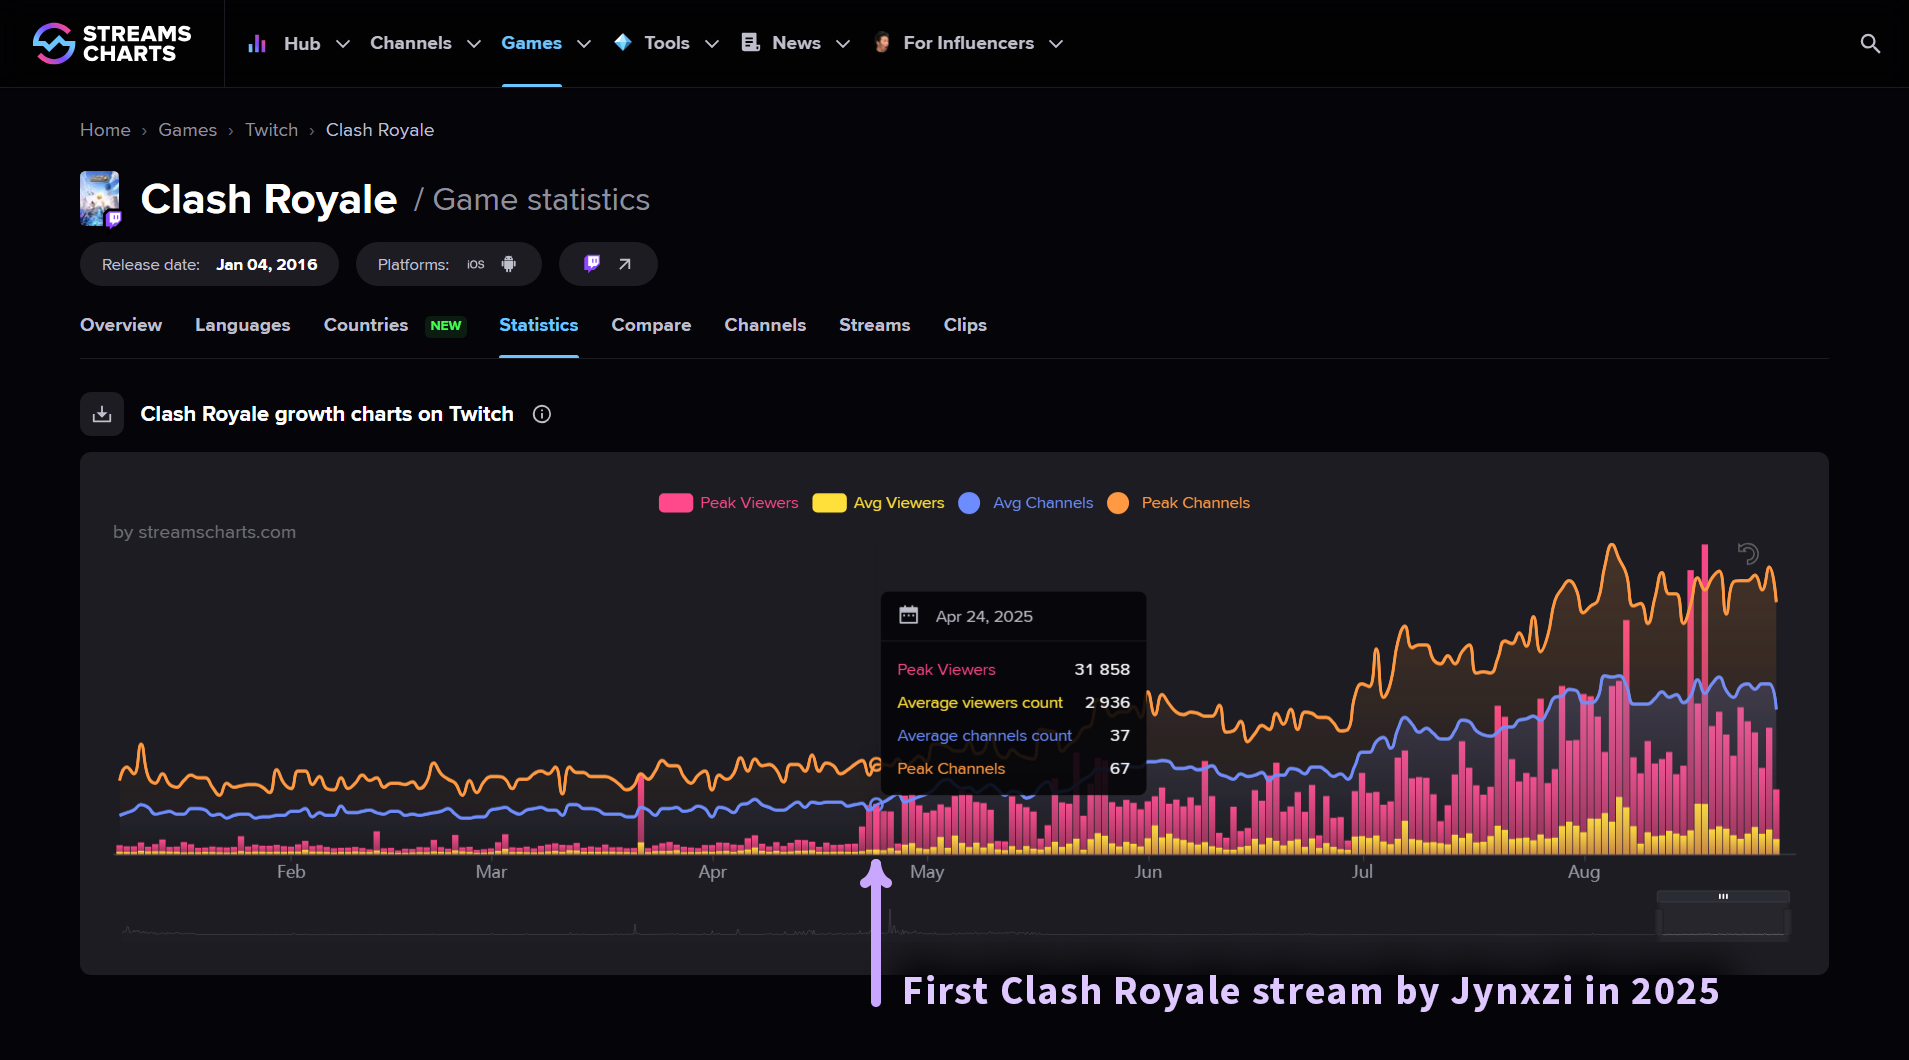
Stats of Jynxzi from Streams Charts.
Aside from content, a lot of attention has gone towards revenue reports. It's common to see comparisons between Supercell games that track their monthly performance.
Recently, Jakub Remiar shared a LinkedIn post showing estimated Clash Royale daily revenue since 2023. In the image, he annotated some significant events with the potential to affect this metric.
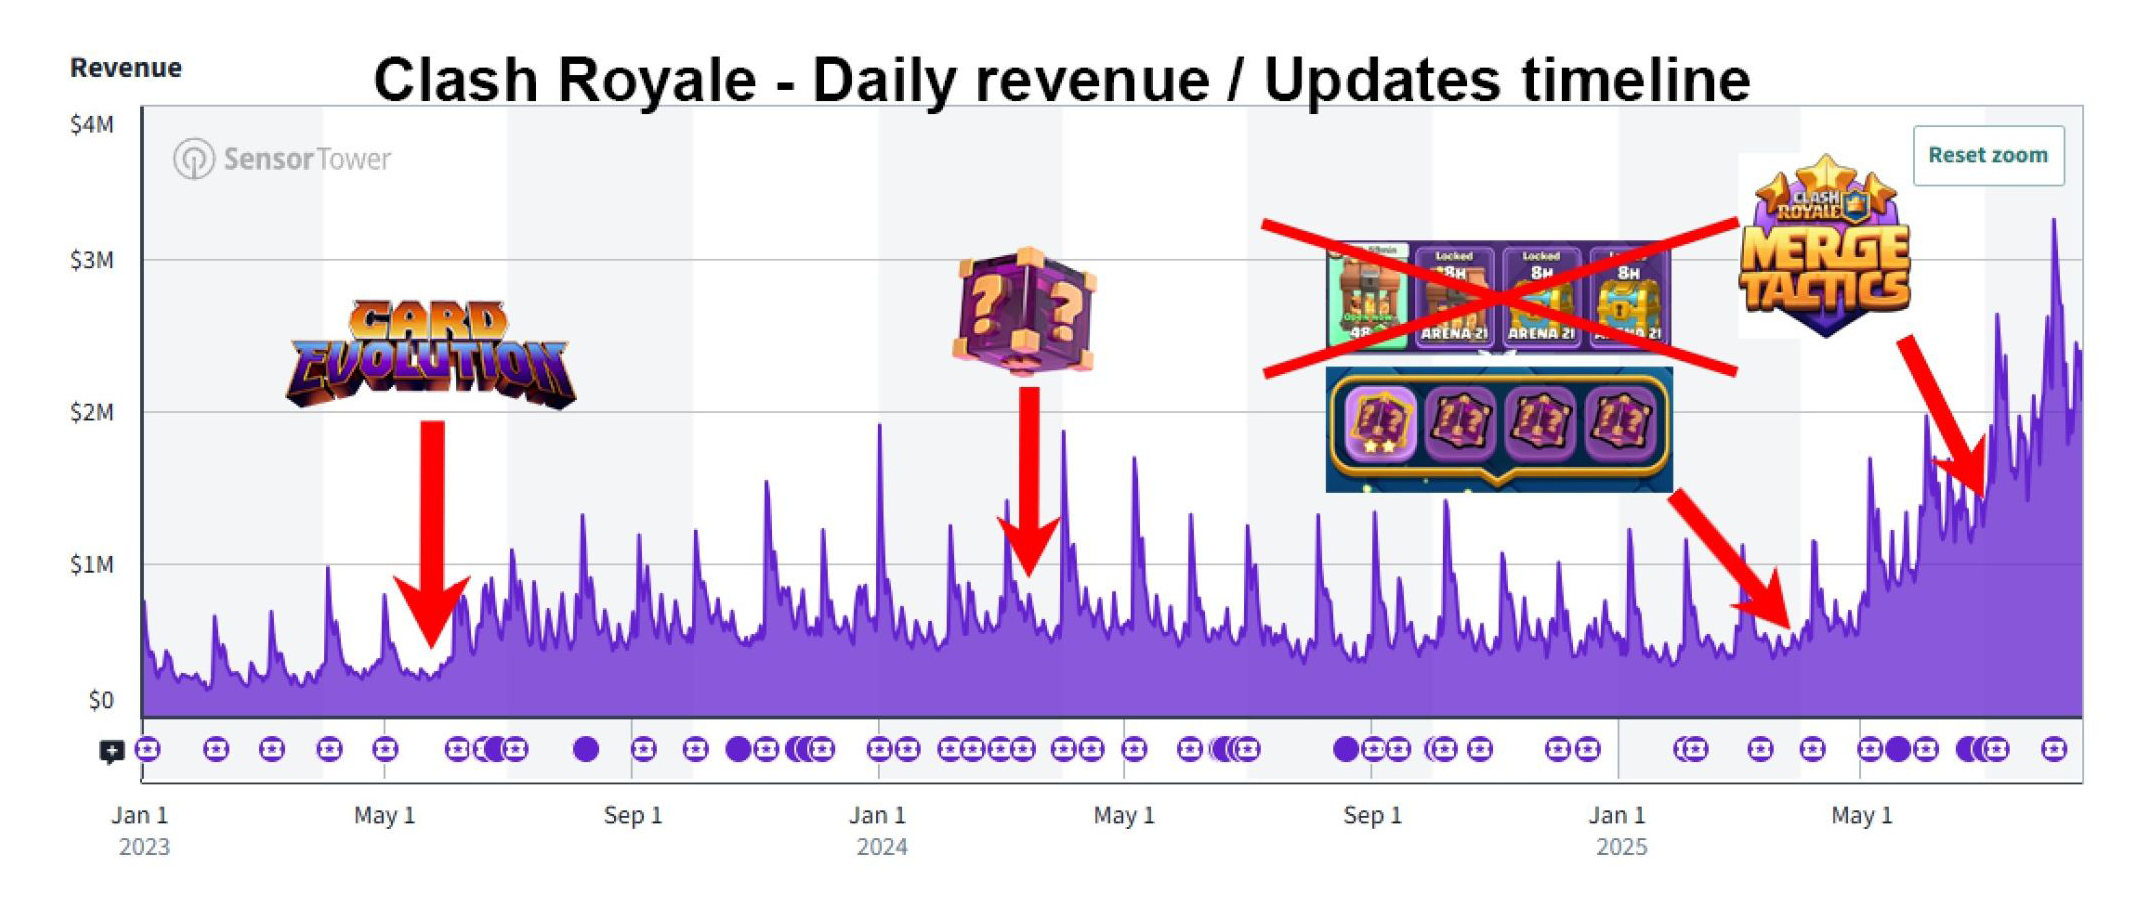
Clash Royale revenue reported by Sensor Tower, annotated by Jakub Remiar
Although the May season of 2025 shows a drastic increase of compared to April, it's also worth noting that April trends upwards after months of decline. This coincides with the 2025 Q1 update, which was released on March 31st.
This update introduced multiple changes to core mechanics of the game, features with which every player interacts daily. We dedicated a separate blog to all the economy changes involved in this update, which were quite complex, but here are the highlights:
Replaced chest slots with daily rewards
Removed the season shop
Significant changes in the game economy
The main effects of these changes were:
Daily rewards are unlocked instantly, as opposed to chests, which had timers. They also remove chest slots as the constraint of obtainable rewards. These two pair together and push players towards longer sessions; instead of filling 1 free chest slot, you can obtain several daily rewards in a row. This change may be very significant because:
- filling a slot would take ~2 battles
- collecting the 4 daily rewards would take ~8 battles
The season shop provided great rewards, but were not visible for most players. Removing this feature and relocating the rewards to the home screen live events makes sessions more rewarding, specially for casuals who now claim these rewards more often.
Available rewards were reduced overall, but it's unclear how this balances out with higher claim rates. Some data points from recent live events suggest these claim rates are now at ~70%, which is likely much more than rates from the Season Shop.
A less visible but very important change in the economy is the lower availability of Magic Items; these wild cards speed up uneven vertical progression. It seems likely that this uneven progression causes players to max out their main decks too fast, which increases user churn. This change is less likely to play a big role in the short term.
On top of this, some background changes that can play a significant role in player experience are bots. Bots have received significant improvements in recent months and may have become more common. We don't have enough data to know how significant the rollout has been, but bots can increase and optimise the speed of player progression through Trophy Road. Churned players often report being stuck in trophies as a source of their frustration, and bots can alleviate that, or at least kick the can down the road for a few extra weeks/months.
And this is all the surface level analysis we can share based on recent events, now let's look at the results of our Q3 snapshot.
New players per year
This chart shows the amount of accounts created per year. These results haven't changed from the previous snapshot for obvious reason, only the 2025 accounts have grown as the year is still in progress.
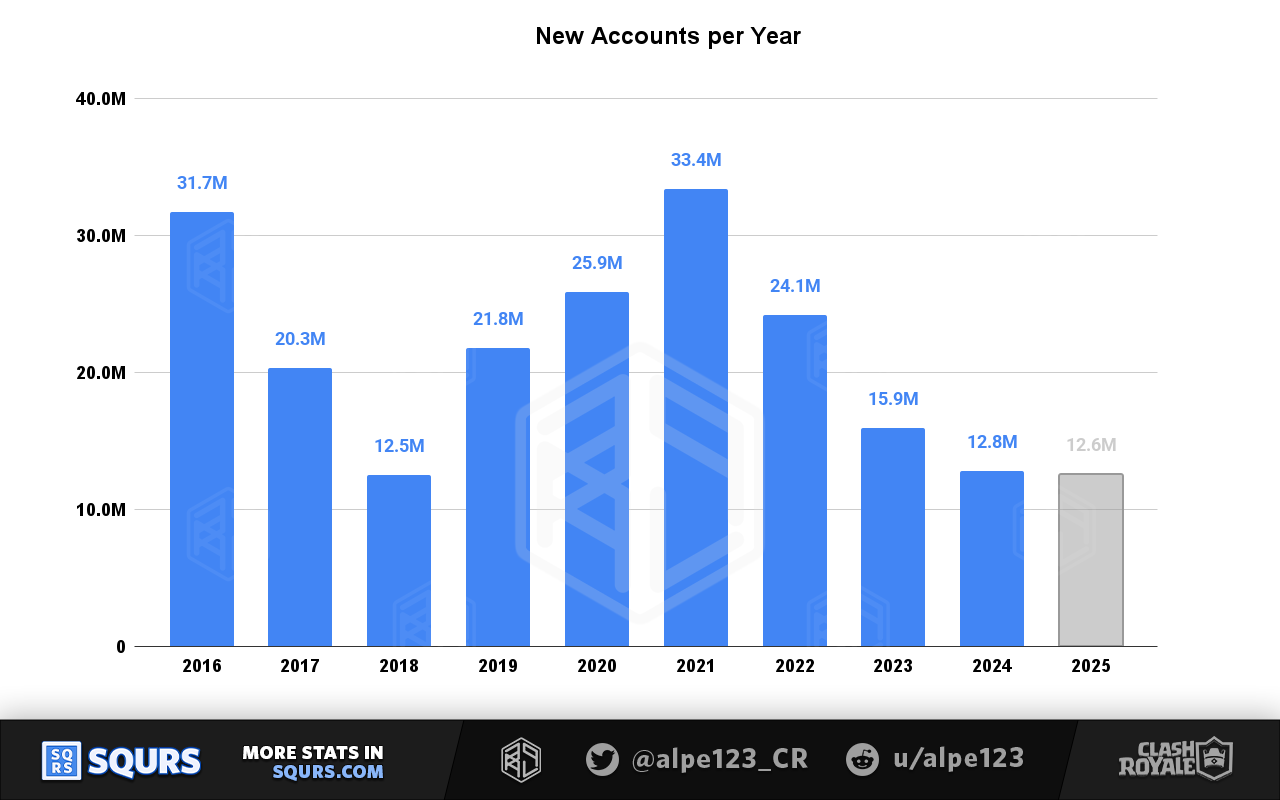
From this chart, we can already see that 2025 is performing better than 2024. Despite having 1/3 of the year left, account creations have already been matched.
The current total of accounts created is over 210M. This value is not equivalent to app installs. As we described earlier, we consider valid accounts those with:
- 5 hours of gameplay
- Not banned, deleted or transferred to the Chinese servers
Active players
There are many ways to measure player engagement. Based on segment duration, there are 3 main alternatives:
- Daily Active Users (DAU) (Played today)
- Pros: useful to see how many players are very engaged with the game, close to habit behaviour
- Cons: very irregular for Clash Royale, and very dependent on player types. E.g.: some casual players may only play during weekdays, a few minutes at a time; more active players may grind during weekends
- Weekly Active Users (WAU) (Played this week)
- Pros: quite good overall, as it removes these day-by-day changes. Weekly patterns are fairly predictable and steady over time
- Cons: vulnerable to spikes produced by seasonal content
- Monthly Active Users (MAU) (Played this month)
- Pros: aligned with seasonal content, so it arguably provides the best overview of the current engagement level
- Cons: harder to distinguish casual from regular players
Over the rest of the blog, we'll mainly use MAU as the active pool of players. This chart shows how the 3 categories of players currently look like compared to each other.
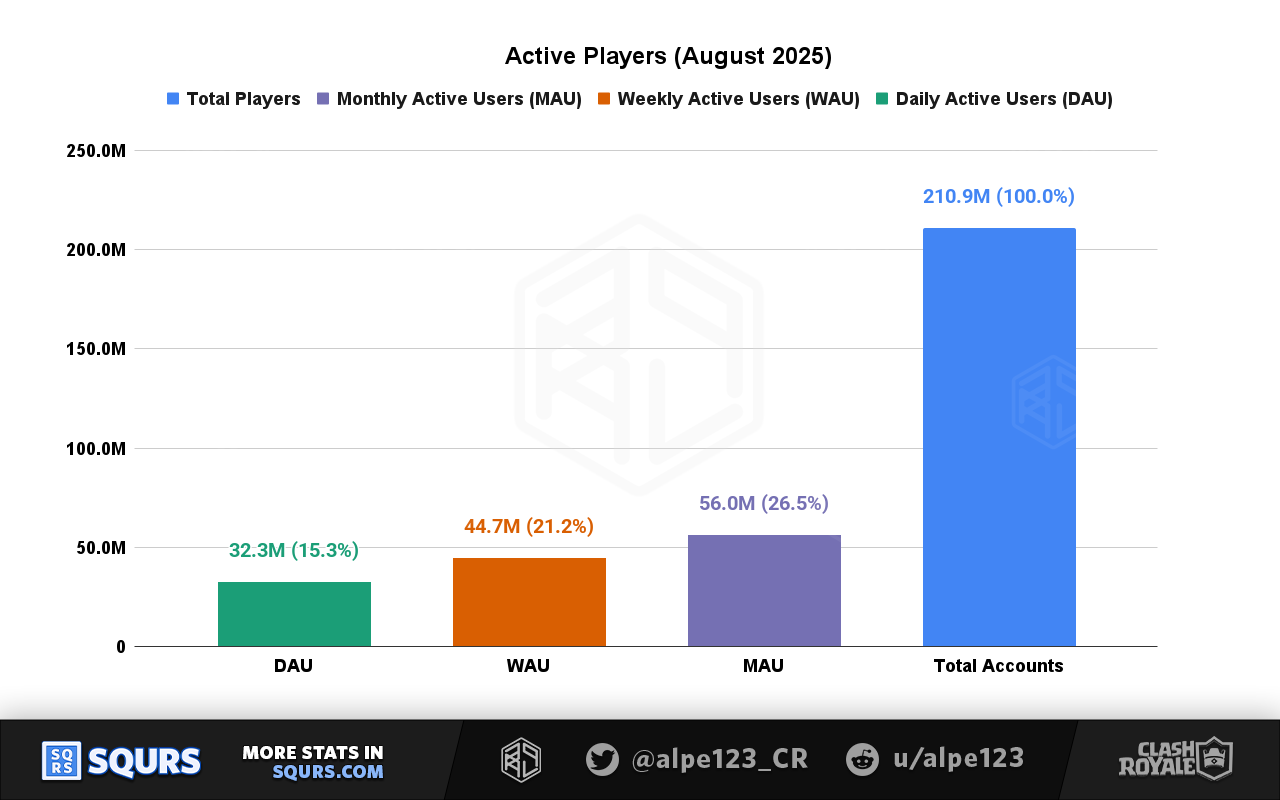
Active players in April 2025
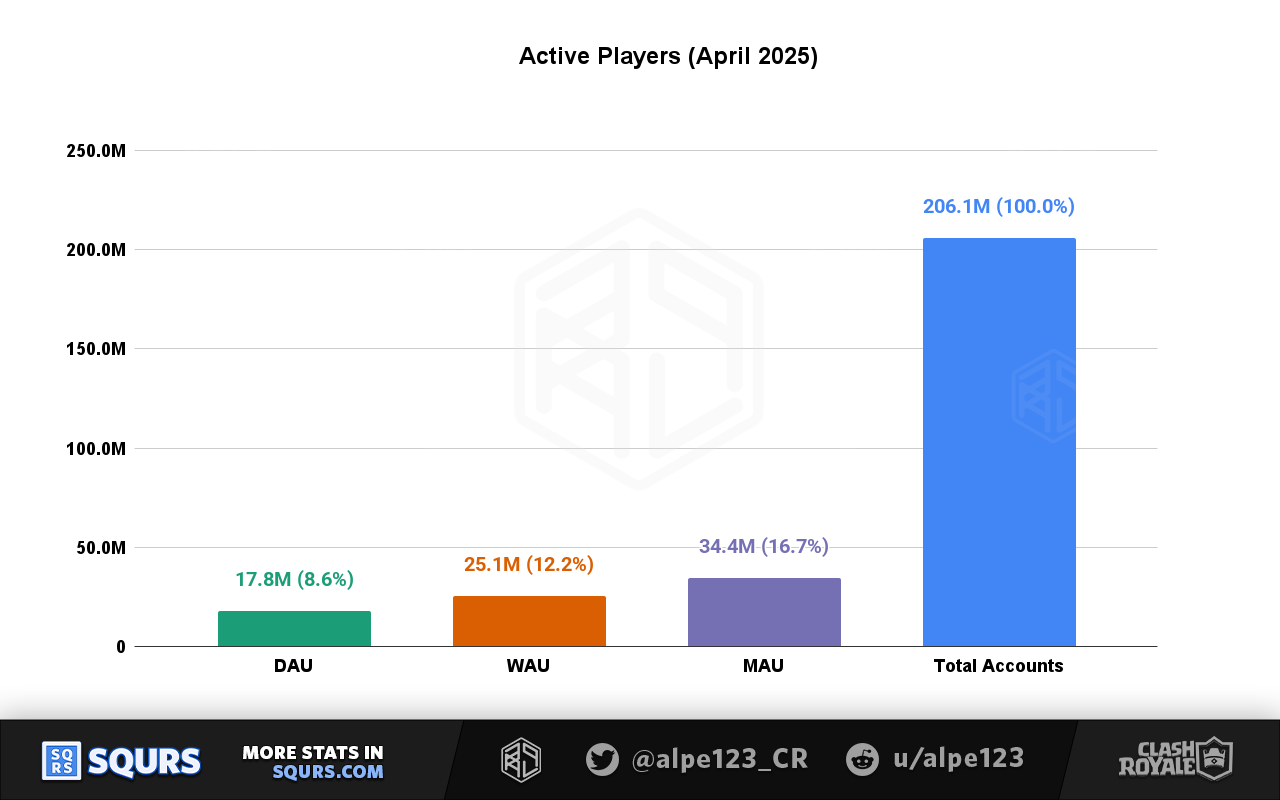
The core stats from this playerbase snapshot are:
- Daily Active Users (DAU) 32.3 Million Players, a +82% increase
- Weekly Active Users (WAU) 44.7 Million Players, a +78% increase
- Monthly Active Users (MAU) 56.0 Million Players, a +63% increase
This chart displays the same data, but highlights the change we have measured from April to August:
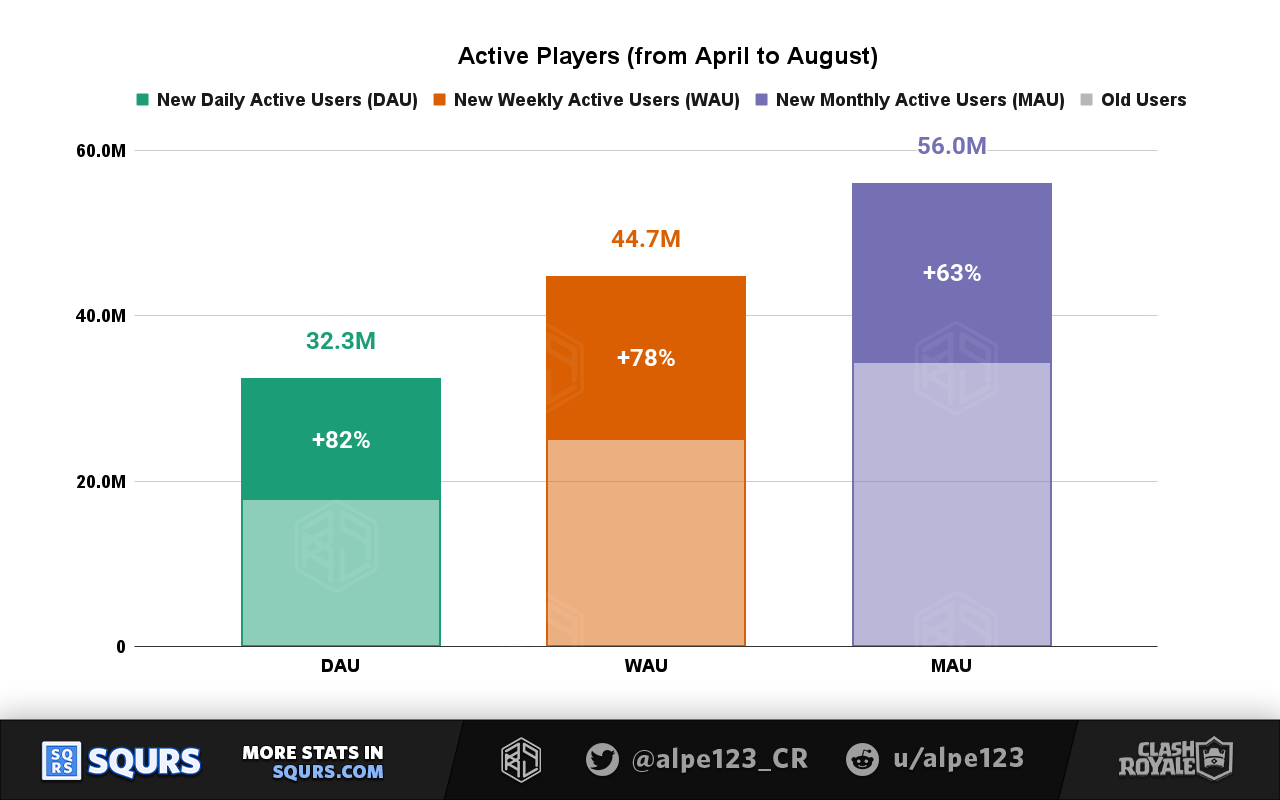
Key Insight #1
Clash Royale had 56 million active players in August. This is a sharp increase compared to the snapshot we took in April, in which we estimated around 34 million active players.
These charts give us a good hint to what has happened. Total accounts have increased by about 4-10 million, but active users by 30 million.
The only way this could happen is with a very significant reactivation of players who had left the game. So let's dig a bit deeper, who has returned to the game?
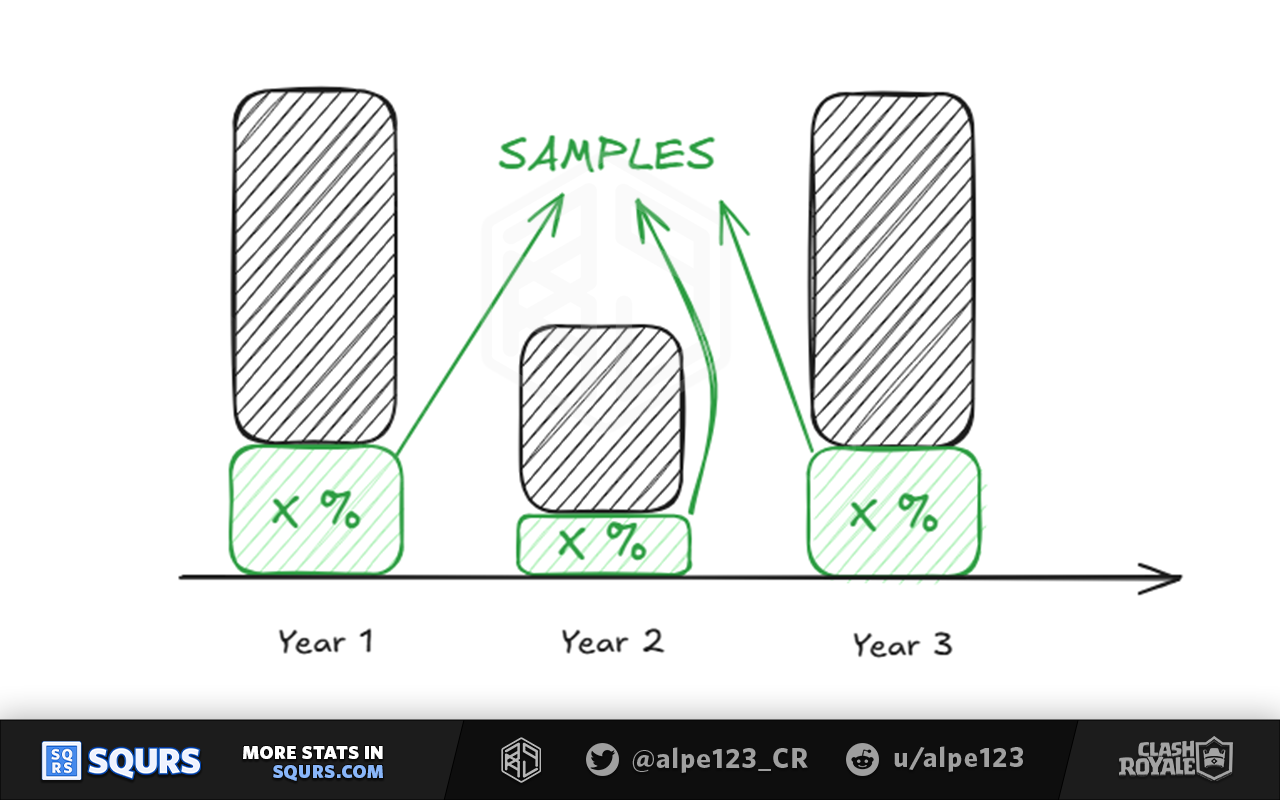
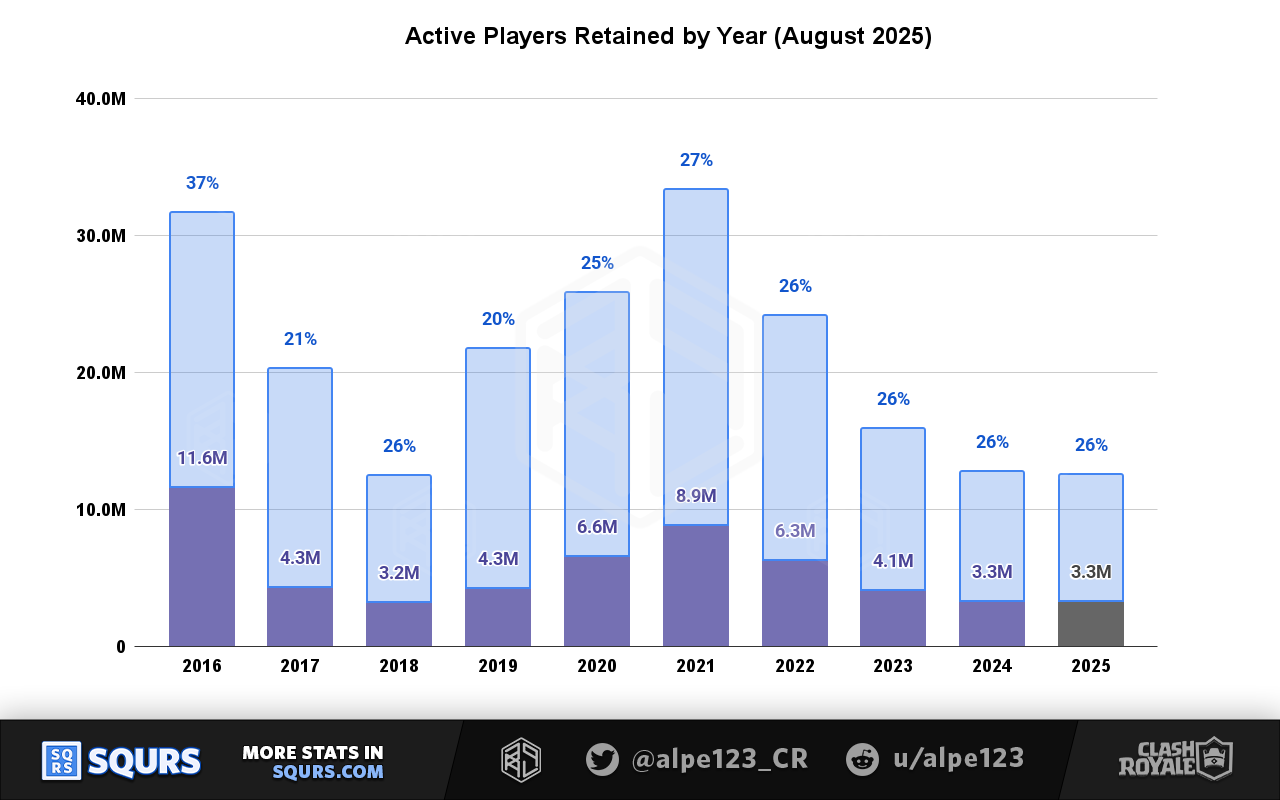
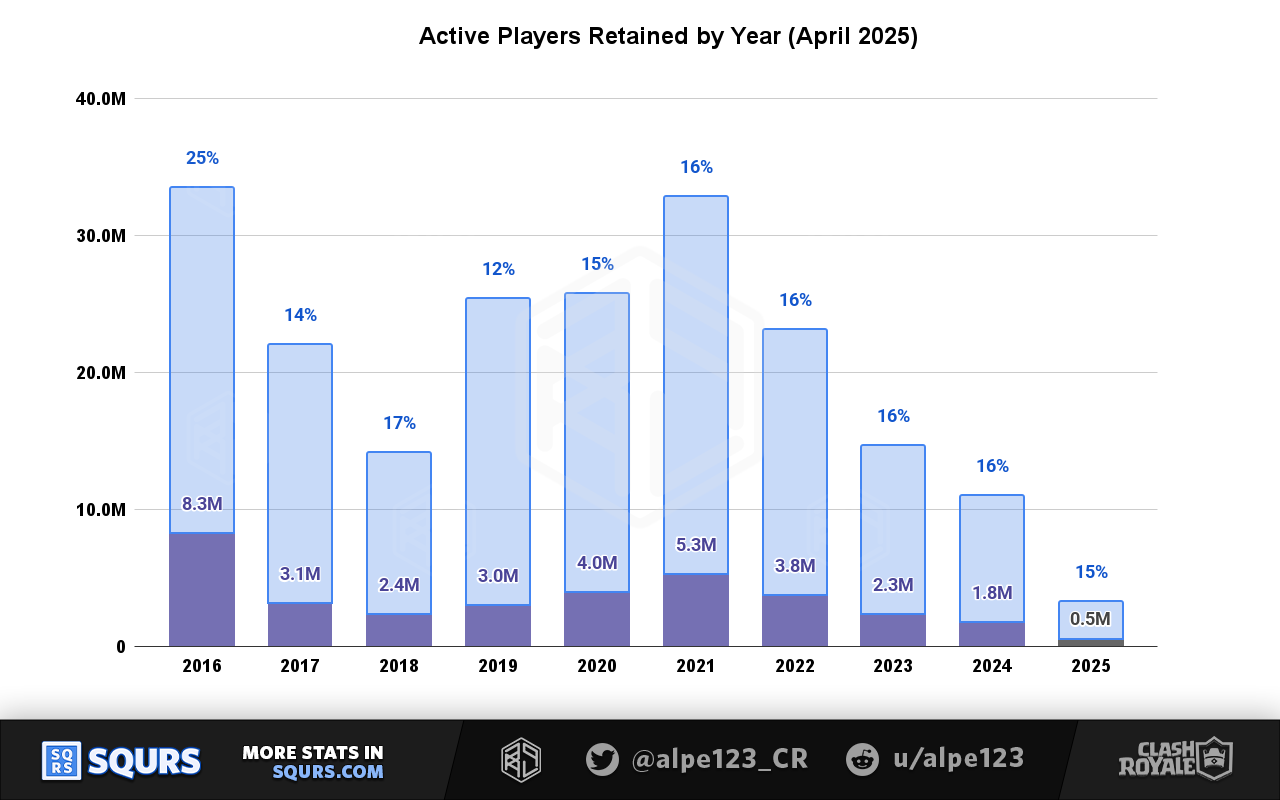
Below we show a distribution of active players (purple) based on the year they created their account, compared to the total of accounts created that year (blue). This gives us the player retention rate for each year, which is the percentage on top of each bar.
Active players by year in April 2025
By looking at retained players by years not much stands out.
- 2016 is the year with the best retention (37%), as we saw in April
- 2017 and 2019 had the worst retentions (21% and 20%)
Aside from the release year, retention has been fairly stable at 20-30%.
A good way to see what has changed since April is to compare these retention rates. The difference in active users would show the players who have returned to the game.
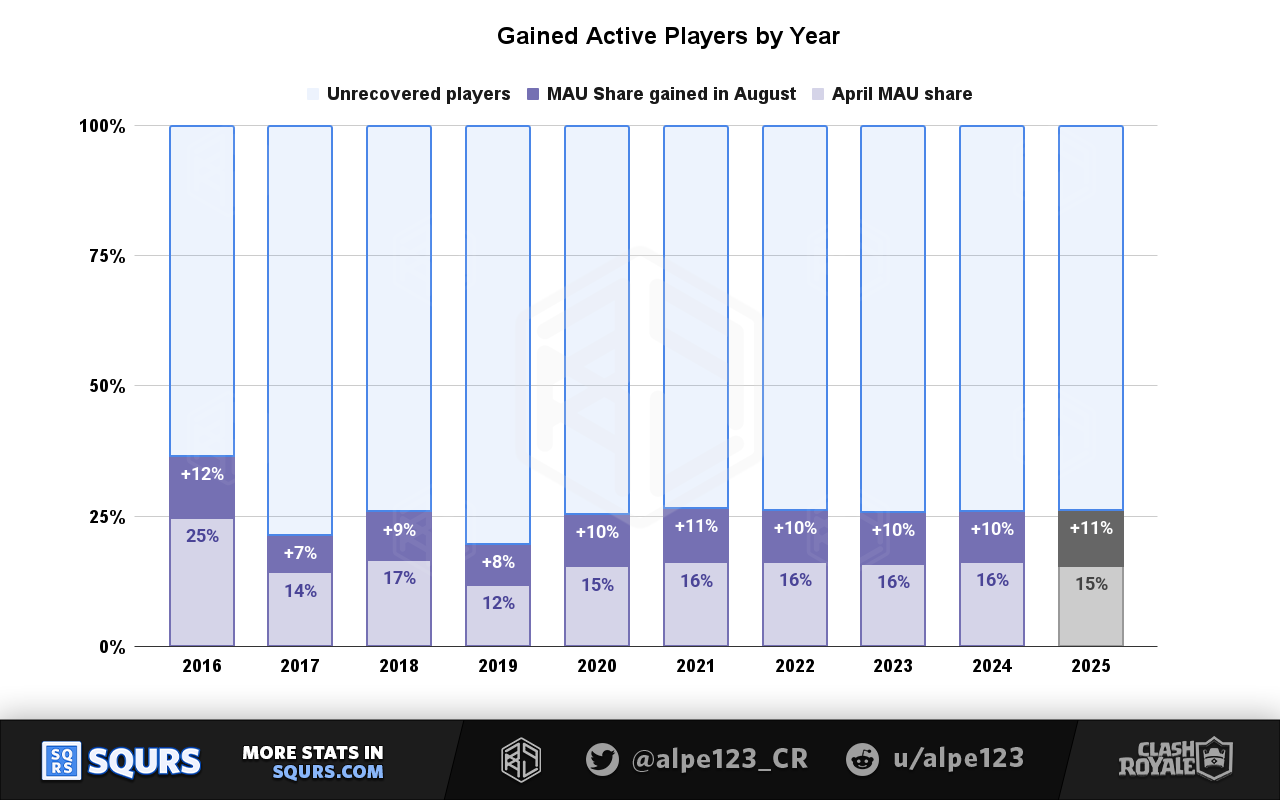
This chart highlights how the active player share changed from April to August.
- In light purple, the active players we had in April
- In dark purple, the new active players
Key Insight #2
The player reactivation is very consistent across the years; around 10% of the all time accounts became active again, almost doubling the amount of active players compared to April.
Active playerbase growth has been driven mainly by reactivation of old players, not acquisition of new ones.
Reactivation seems correlated with the baseline retention share. I.e.: it seems conceivable that years with more churned players had potential for more significant reactivations, but this isn't the case. Instead, years with better retention were the ones with better reactivation.
This could be due to social effects, or because the pool of acquired players in those years was a better match for the game.
Player distribution by trophies
Since the last snapshot, Clash Royale made a major change to Trophy Road. The June 30th update extended the 9K trophy limit to 10K. They also added Seasonal Arenas, which let you climb above 15K.
The Seasonal Arenas extension resets every month, so it's mostly a reflection of active users rather than the entire playerbase.
Seasonal Arenas trophy system
Usual Trophy Road battles change scores with ±30 trophies. In Seasonal Arenas, score changes are ±150 trophies instead.
This dilates the trophy range, but effectively means that the 10-15K range is more like a 10-11K range.
The distribution density is therefore a fifth of the usual range, so we have reduced the bar frequency of this range to keep player counts comparable.
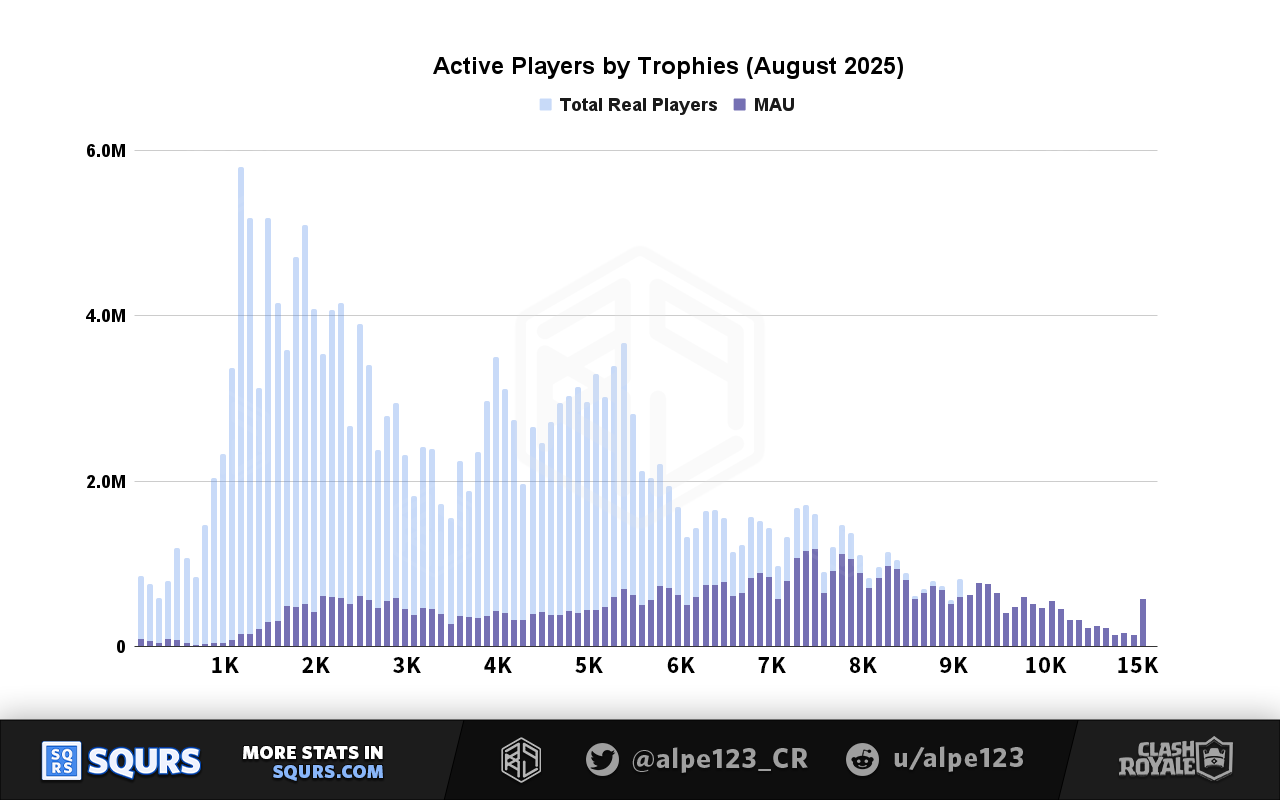
This chart shows the distribution of players by trophies. In light blue, the entire playerbase; in more visible purple, the players who have been active this month.
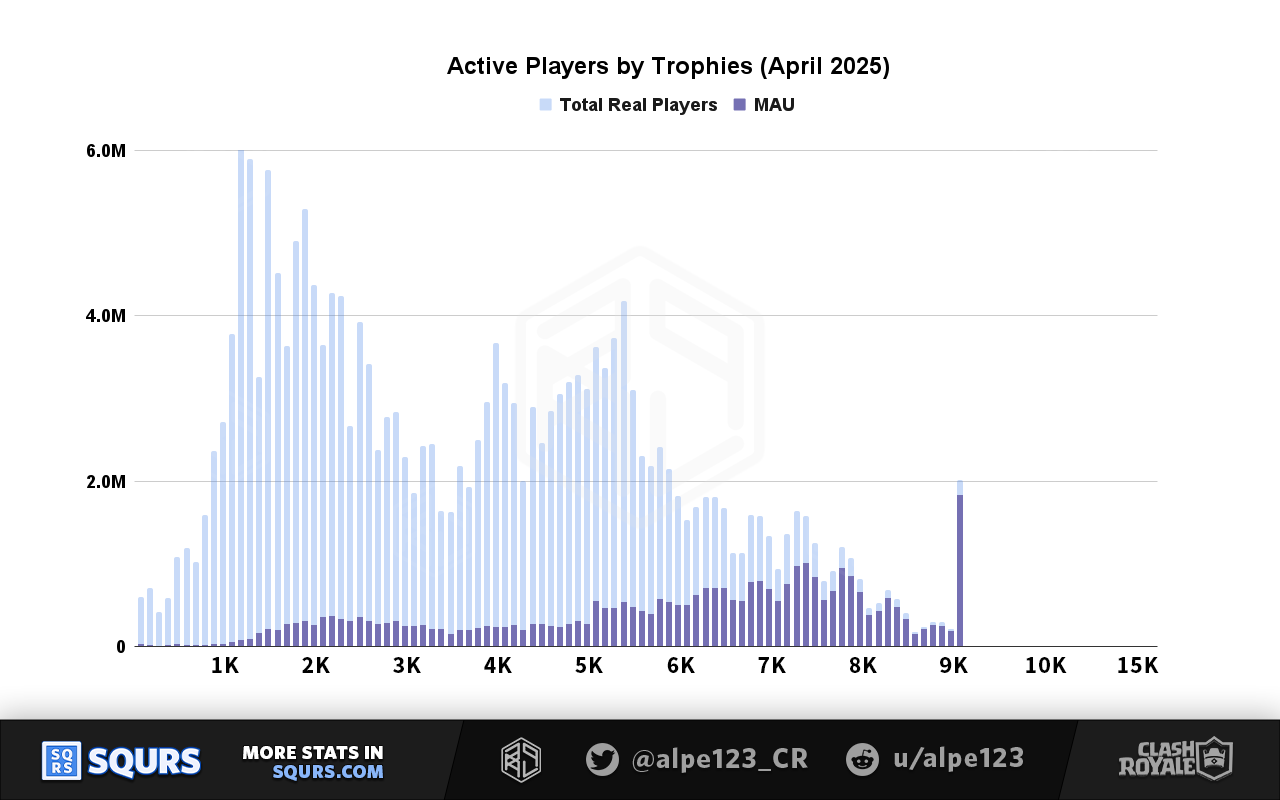
Active players by trophies in April 2025
The player peak we used to see at 9K trophies is entirely gone if we look at active players, although a small peak of inactive players remains visible.
Above 10K trophies, players are fairly evenly distributed in the Seasonal Arenas. The August season still was almost over by the time we took this snapshot, so we'd expect the final distribution to be similar.
Another way to look at this distribution is with a funnel chart that aggregates players under each amount of trophies:
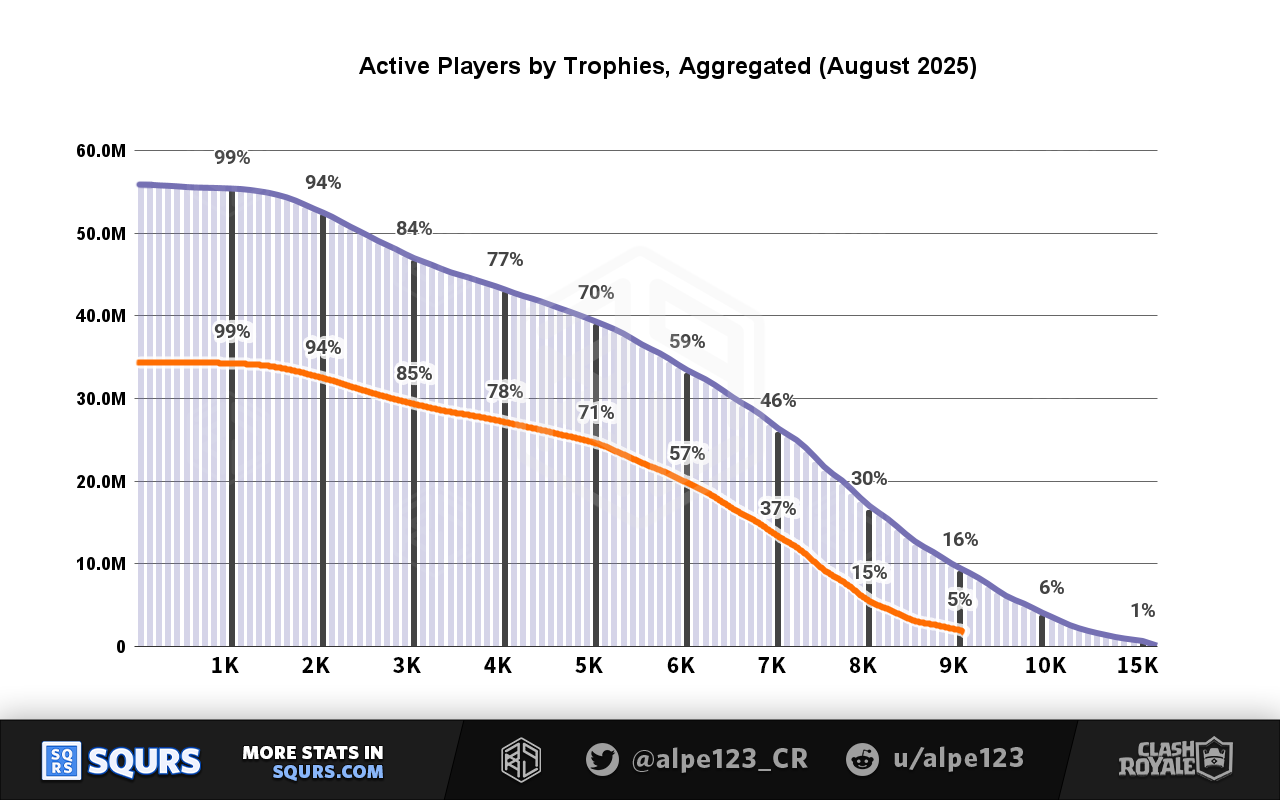
In this comparison, the current distribution (August) is seen in purple. The distribution we had in April is shown in orange. A few relevant insights from this chart are:
- The share of the active playerbase that reached 9K trophies increased from 5% to 16%.
- 6% of the active players have now reached 10K trophies, and only 1% has reached 15K trophies this season.
- Under 6K trophies, the shares of MAUs haven't changed, so the distribution has grown hand in hand with the active playerbase.
- Trophy inflation stands out after 6K trophies, possibly fueled by bots.
Key Insight #3
6% of the active players have reached 10K trophies in August, and only 1% has reached 15K trophies.
Ranked VS Path of Legends
The June 30th update of this year also made significant changes to this competitive-leaning mode. The main ones are:
- Ranked is locked for players unless they reach 15K trophies or League 4 the previous season
- There are 3 less leagues, reducing the total amount from 10 to 7
- Starting leagues no longer have level caps, Level 15 is the standard across the mode
Overall it's now a bit trickier to know who isn't playing Ranked and who simply hasn't unlocked it yet. In the past it was simpler, as players just had to reach Arena 15 at 5K trophies.
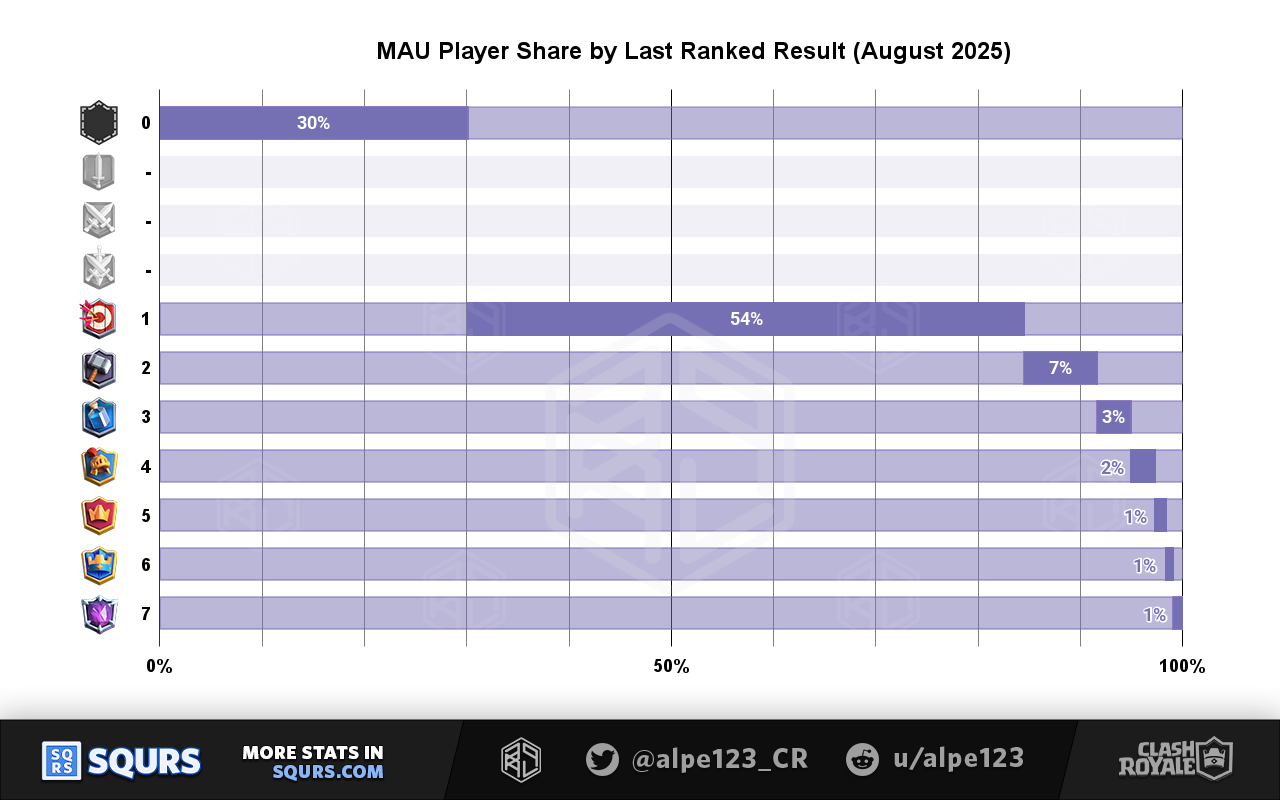
This is the distribution of players based on last rank, which refers to the July season:
Active players by ranked league in April 2025
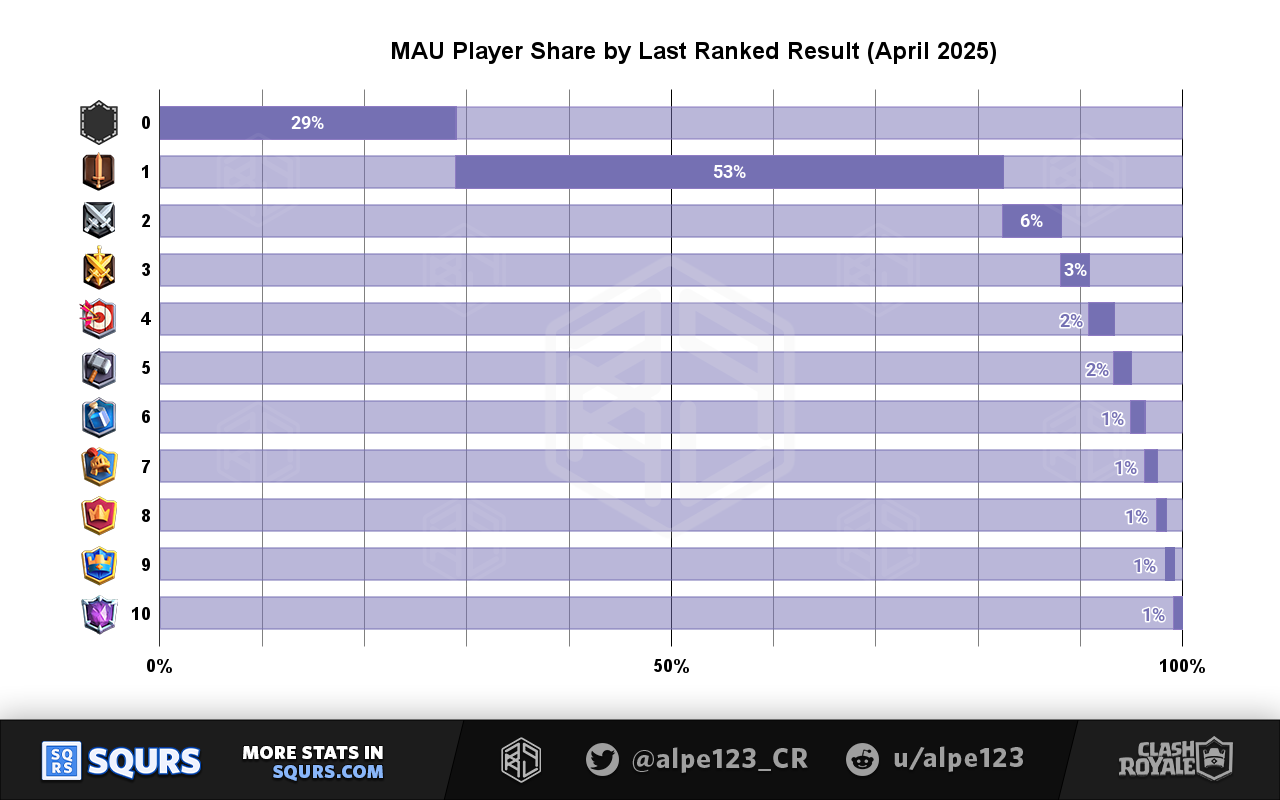
With the new system, this chart shows that:
- League 0 (30%): players who haven't reached Arena 15, which requires Level 24 and 5K trophies.
- League 1 (54%) includes:
- Players who haven't unlocked Ranked
- Players who haven't completed League 1
Only 15% of active players completed League 1 last season. This is slightly lower than the share we saw in April (18%), but very similar.
It seems fair to say that most of the players that were locked out of Ranked weren't actively playing it anyways.
The share of players that reaches the last 3 leagues has also remained very stable despite the changes. Grand Champion, Royal Champion and Ultimate Champion, all of them still finish with ~1% of players each.
Over time, it's possible that the Ranked access restrictions make this mode more exclusive, and we can already see some slight indication of this being the case.
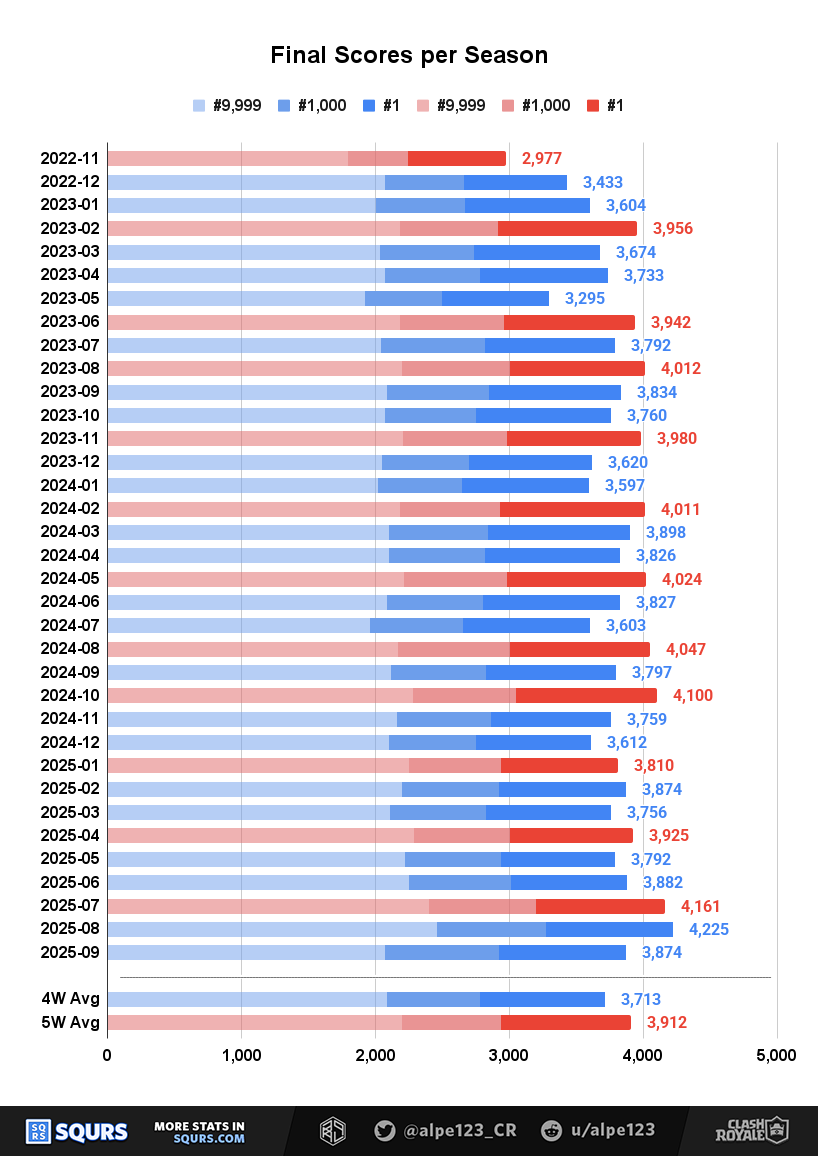
In red, seasons with 5 weeks of duration. In blue, seasons of 4 weeks.
Given the current system, the pool of players with access to Ranked should get lower and lower over time.
The future of Ranked
This can easily be seen with the share of players per league in last season:
- ?% didn't complete League 1
- 15% finished in League 2-3
- 7% reached League 4, which gives the Master Ticket, giving access to the next Ranked season
We can't separate the amount of players without access from those that ended stuck in League 1, but we can still make a conservative estimate: at least 2/3 of Ranked participants didn't reach League 4, losing access to the next season.
This process will divide the pool of players every season. Eventually an equilibrium will be reached, when the amount of players who earn access by reaching 15K trophies matches the amount of players who couldn't reach League 4.
The amount of players that reaches 15K trophies is very small compared to the amount doesn't reach League 4, suggesting we are still far away from this equilibrium.
For reference, at the time we took this snapshot:
- The League 4 cut would reduce the pool from 9M to 3M
- 600K players have reached 15K trophies
- 400K of those players had reached League 4
This would mean a reduction of 6M players and an influx of 200K players from Seasonal Arenas; far away from being balanced.
Merge Tactics
This rework of Clash Mini was added to the game also with the last update, on June 30th. Some sources have linked this addition to the recent popularity of Clash Royale as a whole, but as we saw earlier, it was added after the rise had already started. But still, how influential has it really been?
The API integration of this mode is almost non-existent, so we don't have much data to work with. We are basically limited to the main Merge Tactics score shown in profiles, known as Crystals.
Crystal scores vs battles
Like trophies, this score increases with wins and decreases with losses. This means that scores will depend mainly on player win rate and battles played.
This mode has a very significant amount of bots, but it's hard to say how many; it changes over time and based on scores. Estimating average win rates is challenging for this reason, but we estimate that players earn an average of 10 Crystals per game when they start playing.
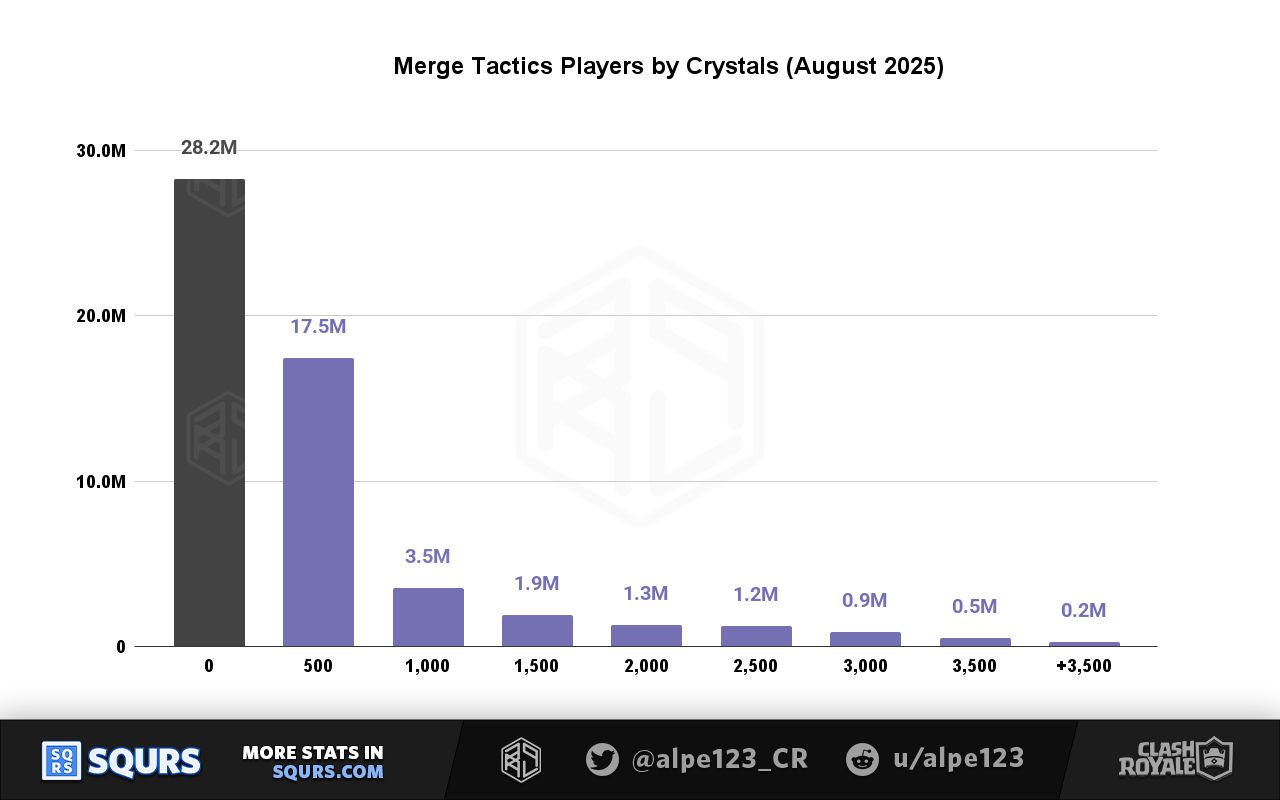
In this chart you can see the a distribution of monthly active players by score, in ranges of 500 Crystals. The first column, with a null score, refers to players who haven't played this mode.
Some summary stats from this distribution:
More than half of players (51%) haven't played Merge Tactics.
From those who tried it, 38% didn't get past 100 Crystals.
About 10 million players have more than 500 Crystals. This is 35% of those who tried MT, and 17% of the active playerbase.
About 240K players have reached Diamond league, at 3,500 Crystals. This score unlocks ranked mode, and has been reached by less than 1% of those who tried Merge Tactics.
It's unclear how many players are regularly playing this mode at the moment.
Key Insight #5
About 50% of the active players have tried playing Merge Tactics. Of them, only 35% reached 500 Crystals.
We also wanted to see how many of the players who tried Merge Tactics are still playing it. To do that, we checked the Merge Tactics scores of our initial sample a week later. These were the main conclusions:
6 million (21%) of those who had tried MT played again this week
1 million players tried it for the first time this week
3 million players increased their score by more than 100 Crystals
The mode retention is modest, but it's worth noting that the content has barely changed at all since it was introduced. There have been a few rounds of balance, but nothing major. We'll have to see if new troops or a score reset is enough for players to pick it up again.
Evolution Unlock Counts
Clash Royale keeps adding evolutions to the game very regularly, at least one per month. This continuously extends a second layer of horizontal progression in a way that seems more sustainable than new cards.
As many players came back to the game, live events have rewarded full evolutions much more often than we were used to. The total pool of evolutions currently sits at 35, but it remains a fairly rare resource for most players.
This is a funnel distribution of active players by evolution count:
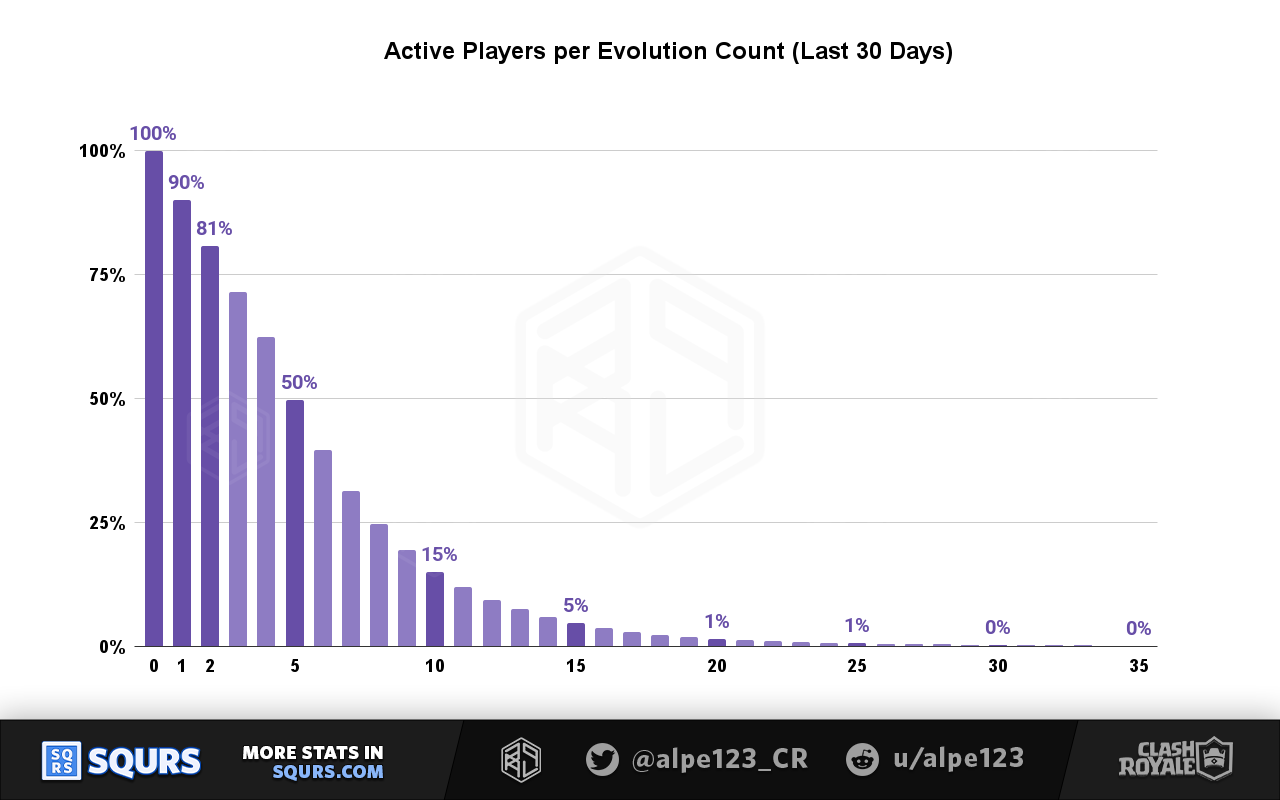
More than 80% of players have at least 2 evolutions.
50% of players have more than 5 evolutions, the median of the distribution.
Only 1% of players have more than 20 evolutions.
These results make it seem as if most players still have a lot of horizontal progression available, but it may not be relevant for them. Most players tend to stick with their usual deck, so unlocking new cards and evolutions is unlikely to be appealing or change their experience.
Most Unlocked Evolutions
Not all evolutions are equally popular. Aside from being better or worse, Clash Royale gives them as free rewards fairly often. This causes some evolutions to be much more accessible than others.
This chart shows all the evolutions, in chronological order based on release date.
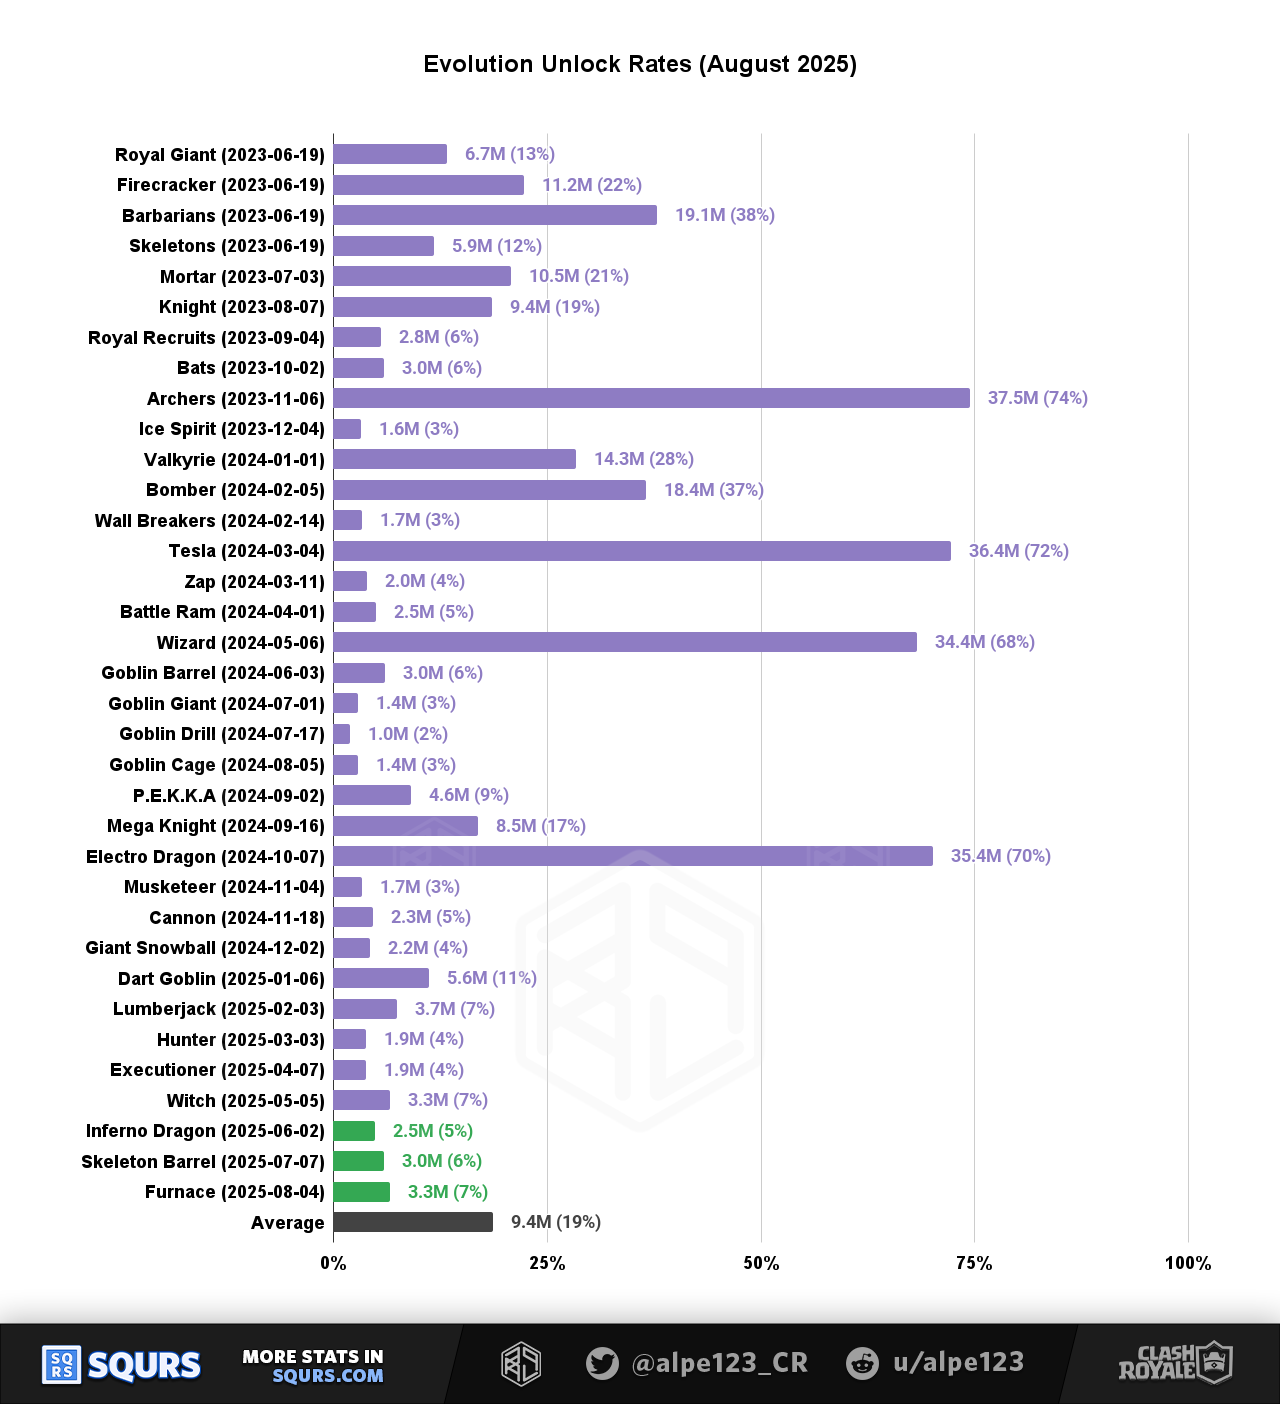
At the moment, the most unlocked evolutions by active players are:
Archers (74%): full evolution was a free reward for the milestone event that lasted from August 11th to 18th
Tesla (72%): full evolution was a free reward for the milestone event that lasted from July 28th to August 4th
Electro Dragon (70%): full evolution was a free reward for the milestone event that lasted from August 4th to 11th
These 3 are the evolutions that were given away most recently, which makes sense given we are looking at the currently active playerbase. The unlock rate of evolutions that were given away is diluted over time, as new players join and old ones leave.
Key Insight #7
Recent live events (featured in the home tab) have increased evolution accessibility for most players. More than 70% of active players have claimed these rewards.
If we look at unlock rates of recent evolutions, we can get a good sense of how many players bought Pass Royale. But for this snapshot we developed a more precise method find these stats, which we'll cover later.
Players by age
How old are Clash Royale players? This may be the first time these demographic stats of the playerbase are seen publicly, and it seems very relevant to understand the state of the game.
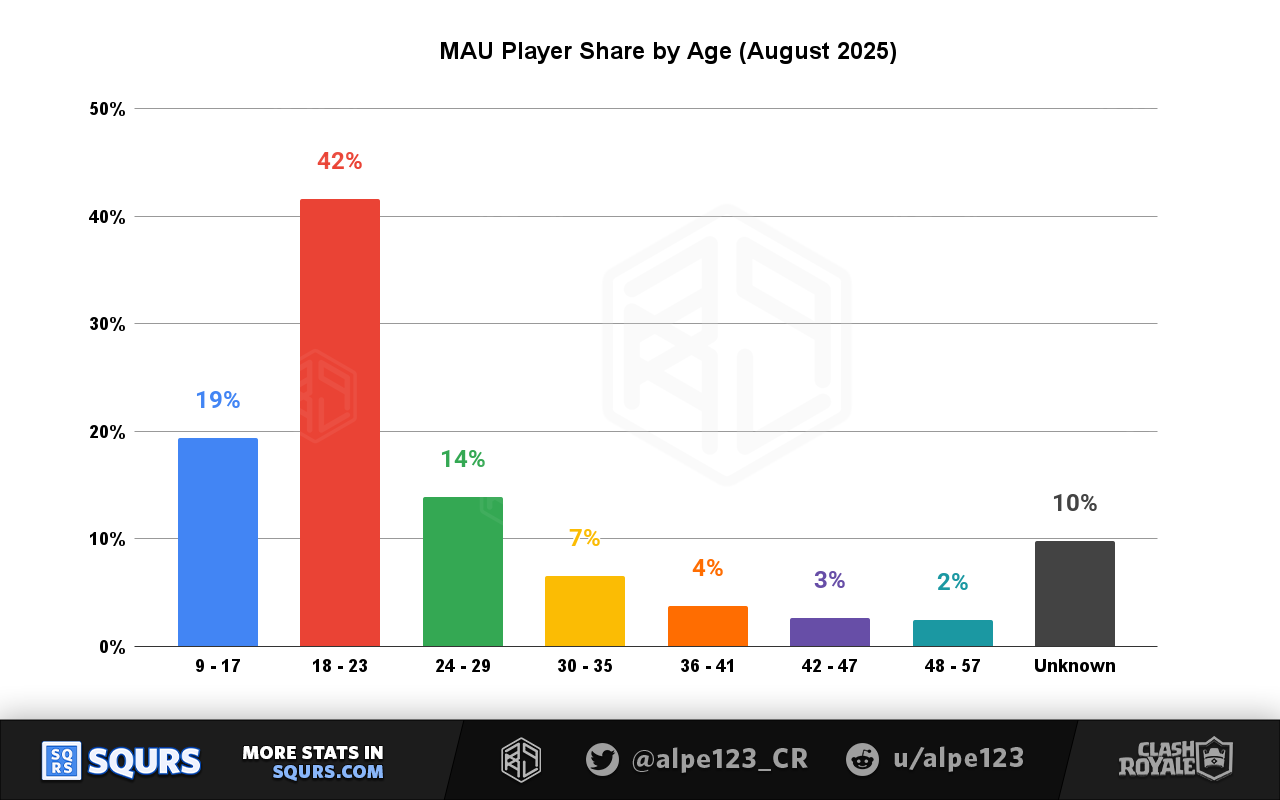
The age distribution has a clear peak at 20-21 years of age; an average of 23 and a median of 21.
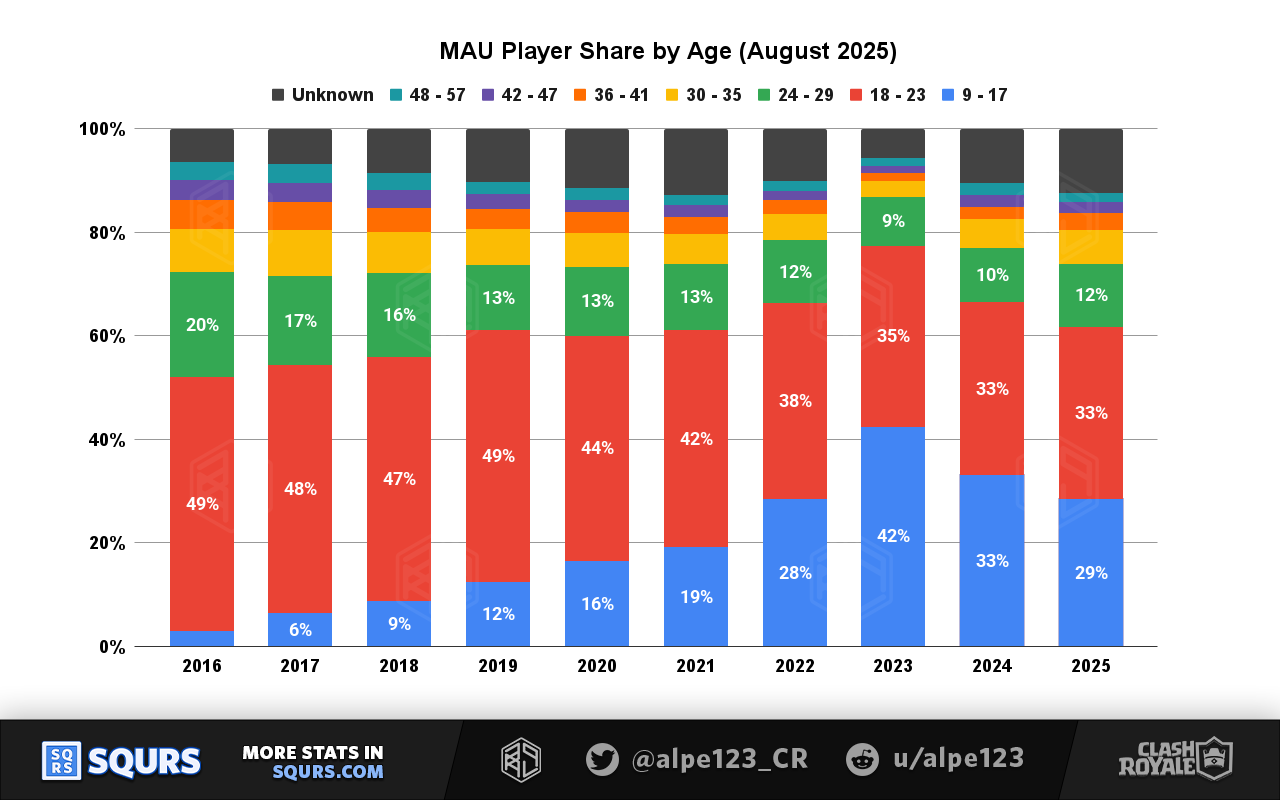
If we break apply this age segmentation to the accounts created per year, we can see how player ages change over time. This change seems mainly due to players growing up since they joined, instead of a very different user acquisition mix.
Segmentation by joining age
If we deduct the years they've been playing, we can find out the ages with which players joined:
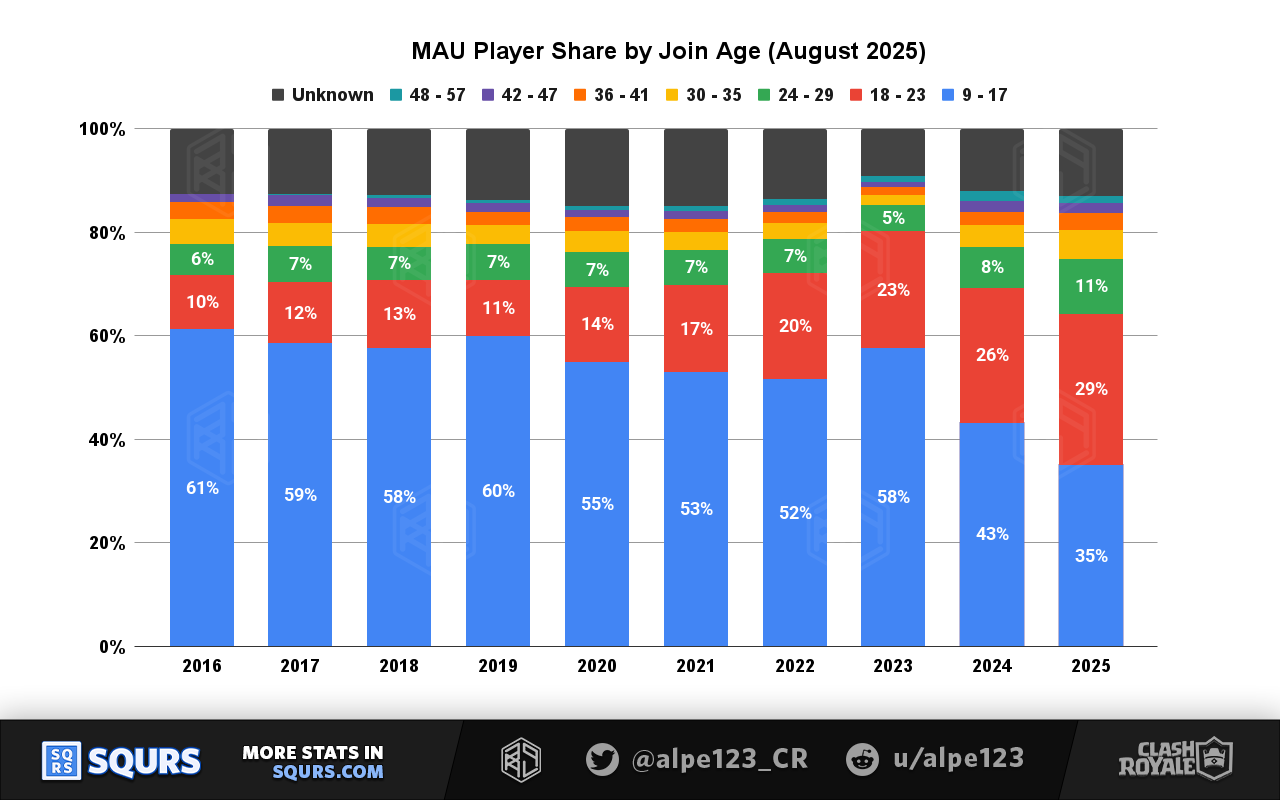
The joining age of players has is much more homogeneous.
Acquired users of recent years seems to be older, but that may be due to survivor bias. Remember that these shares are all relative to the active playerbase, so it's not a complete breakdown of the acquired players each year.
A plausible explanation is: younger players have better retention than older players over the years. This causes the remaining players to be younger on average than the starting pool.
Pass Royale buyers
Our game revenue analysis is very different to estimates provided by other sources. Our results are based on the amount of players who buy Pass Royale.
Pass Royale is the main item players buy regularly, but it's far from the only one. It's not directly comparable to other estimates, but still relevant and useful. Here are the main differences:
We track players with Pass Royale, not actual revenue
Our results include all Pass Royale purchases, regardless of the payment method. This includes the official web store
We can't know if players took advantage of local pricing or discounts
Key Insight #9
We estimate that around 6% of active players bought Pass Royale during August (Season 74). This translates to 3.3 million players.
Without considering store fees, this is a total revenue of $40 million just from Pass Royale.
These results also show that using evolution unlocks as a proxy for Pass Royale estimates gets us decent results, but overcounts by ~10%. This is likely due to players who use their Evolution Wild Shards when a evolution is powerful; this was the case last season, as Evolved Furnace was the most used evolution of the meta.
Given that we rely on active players to find purchase rates, we cannot uncover how these values have evolved over the years. But here are a few more stats:
Of the 3.3M buyers, this was the first Pass Royale purchase for 28% of them
Of the 3.3M buyers, 15% have bought Pass Royale 10 or more times
Of the 3.3M buyers, 43% had also bought Pass Royale last season (Season 73)
The Pass Royale purchase rate increases with trophies. This makes sense, as trophies are a fairly good metric to rate the engagement and experience of players.
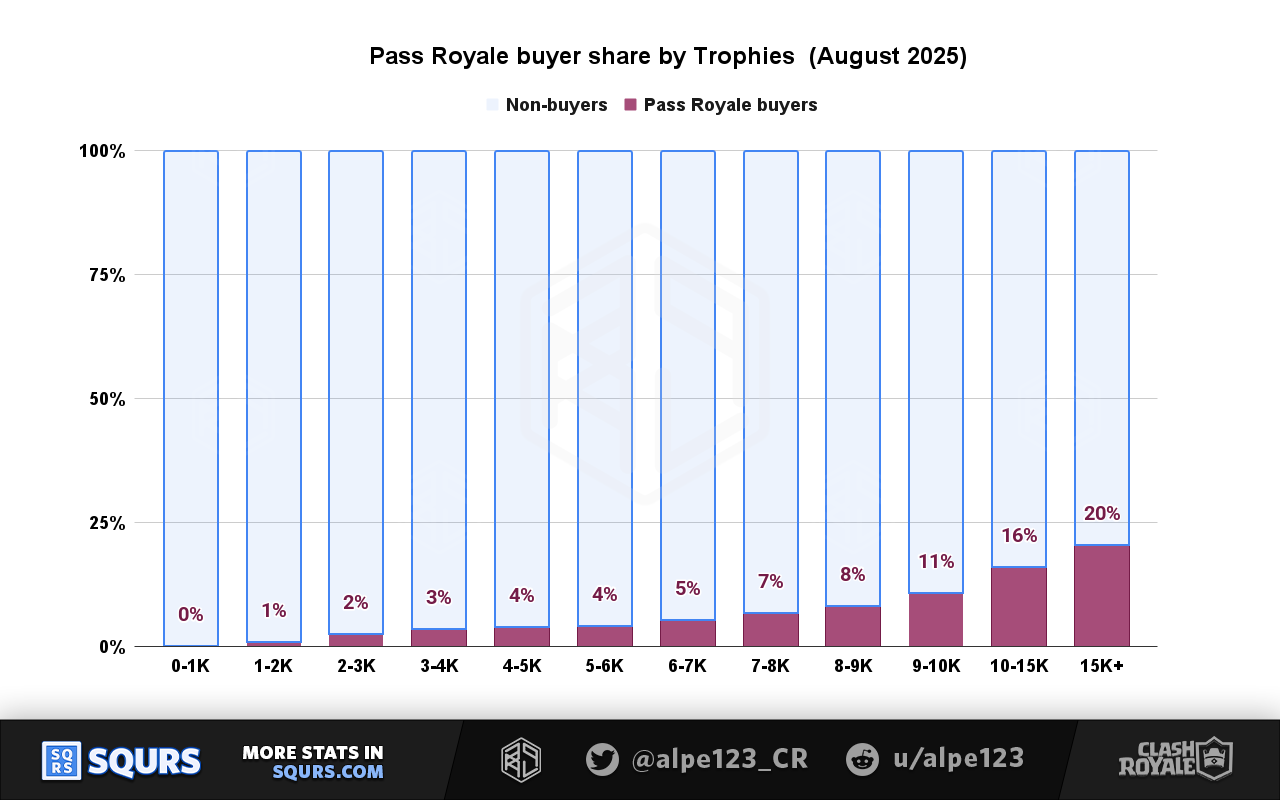
However, it's important to keep in mind that the player pools at higher trophies are smaller, so high-trophy players don't provide as much revenue in aggregate.
This chart shows the absolute number of buyers by trophy range:
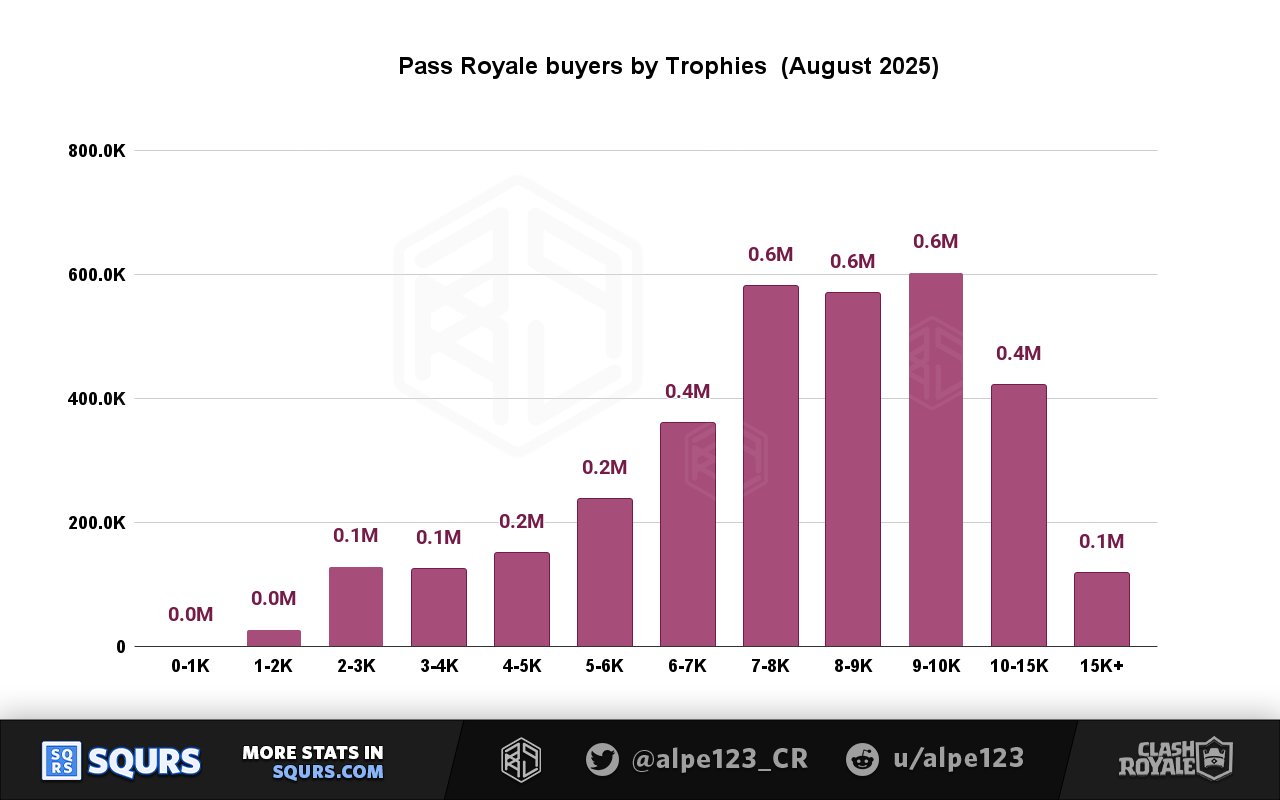
Key Insight #10
While players above 10K trophies have a higher purchase rate for Pass Royale, more than 50% of the revenue comes from players in the 7K to 10K range.
This distribution should be relevant to any player who believes the most hardcore players are the most important for the game. In terms of Pass Royale purchases, players that have reached 10K trophies just contribute 16% of the total revenue.
Pass Royale buyers by age
We are now going to combine the information of the 2 previous sections: age groups and Pass Royale purchase rates.
This should give us another perspective for each of the age groups, as having millions of active players may not be very useful with very low conversions.
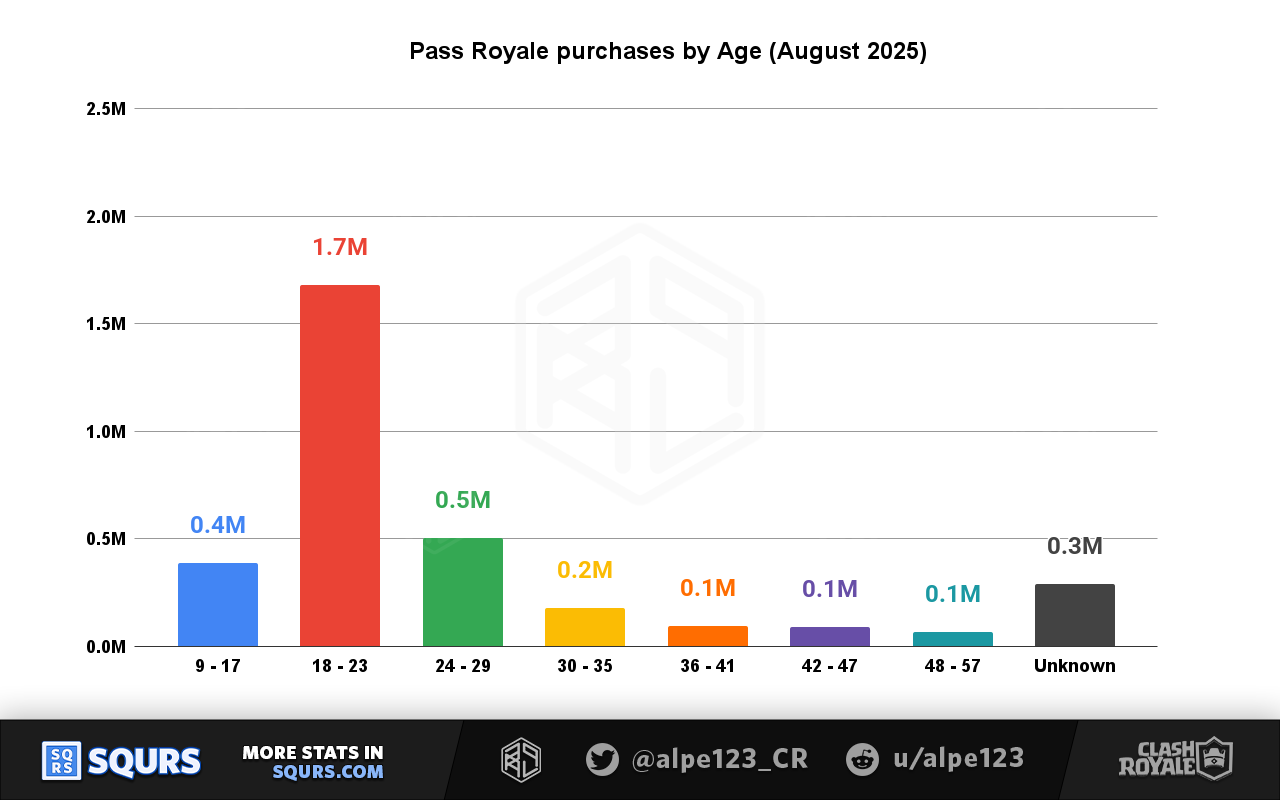
As it turns out, the 18 to 23 age group is not only the biggest one, but also the one with the best Pass Royale conversion. These 2 results multiply each other, making the revenue of this age group higher than all the others combined.
Key Insight #11
Active players between 18 and 23 years old provide 51% of the revenue from Pass Royale.
Here's a simpler comparison of Pass Royale purchase rates for each age group:
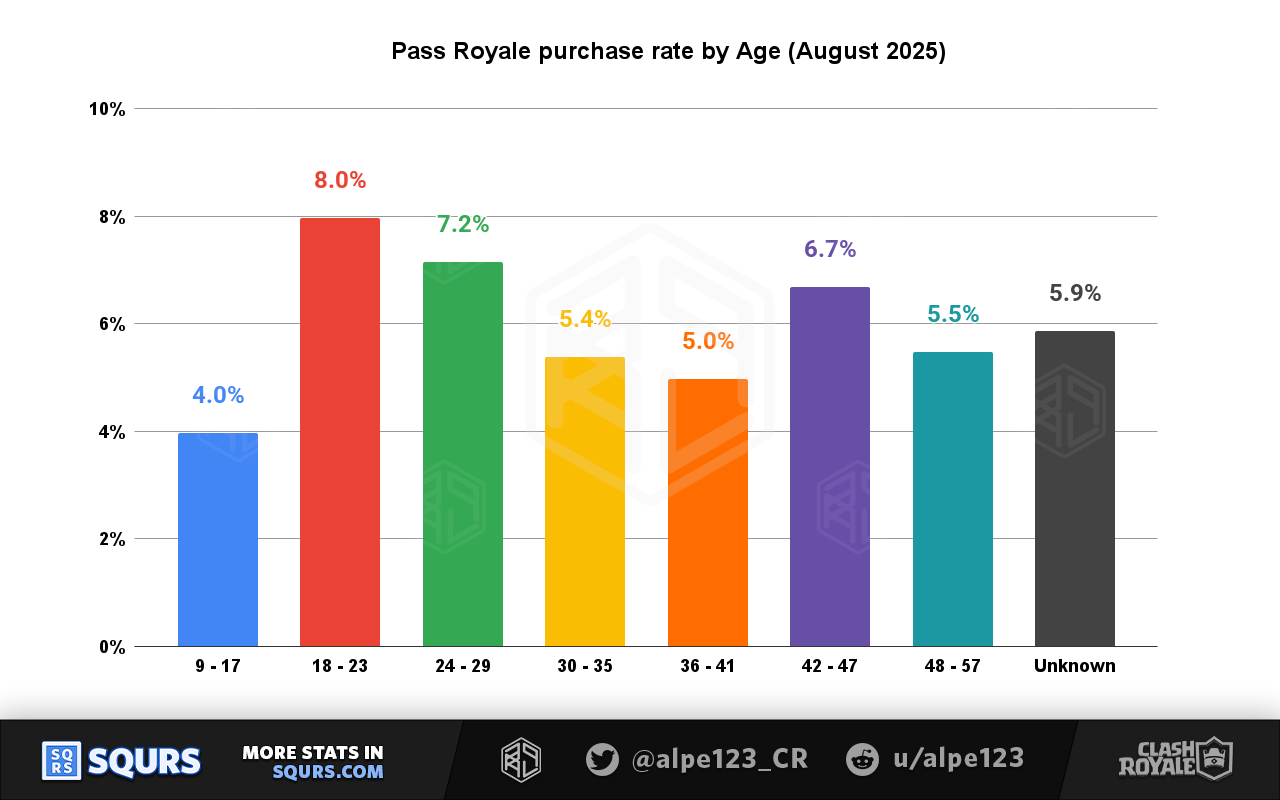
If estimates from Sensor Tower are realistic, this would just be one side of the story, and other kinds of app purchases could lead to 30-40% of the total revenue. Or maybe even higher depending of web store usage. Unfortunately, we don't have reliable insights about that either.
Other stats, feedback and contact
This blog has gotten quite long again, so we'll leave more stats and charts until the next time. Will Clash Royale keep growing? Will all the returning players be retained?
Whatever happens in the following months will surely be interesting to analyse!
As always, if you have any questions or requests for future content, you can:
- Join our Discord Server
- Message or mention mention us on Twitter, @Alpe123_CR